

My First Data Science Project | Internship at Valentius Kryptix
Introduction
Every data science project begins with understanding the data. Before building machine learning models or making predictions, it is important to explore the dataset, identify patterns, and understand the information it contains. This process is known as Exploratory Data Analysis (EDA).
As part of my internship at Valentius Kryptix, I worked on my first project, Python & Pandas EDA, where I explored the Netflix Movies and TV Shows dataset using Python and its data analysis libraries.
In this blog, I’ll share my project workflow, the techniques I used, some interesting observations, and what I learned throughout the process.
1. About the Project
The main objective of this project was to perform Exploratory Data Analysis on a real-world Netflix dataset and discover meaningful insights about its content.
I selected the Netflix Movies and TV Shows dataset from Kaggle.
The dataset contains:
- 8,807 records.
- 12 columns.
- Information about movies and television shows.
- Details such as titles, directors, cast, countries, release years, ratings, durations, and genres.
Dataset Source: Netflix Movies and TV Shows – Kaggle
2. Tools and Technologies Used
I used the following tools and Python libraries throughout the project:
- Python: Main programming language used for the analysis.
- Pandas: Loading, exploring, and manipulating the dataset.
- NumPy: Numerical operations and calculations.
- Matplotlib: Creating charts and visualisations.
- Seaborn: Exploring data through statistical visualisations.
- Jupyter Notebook: Writing and executing code interactively using VS Code.
3. My EDA Workflow
I followed a structured approach to analyse the dataset.
Step 1: Loading and Understanding the Data
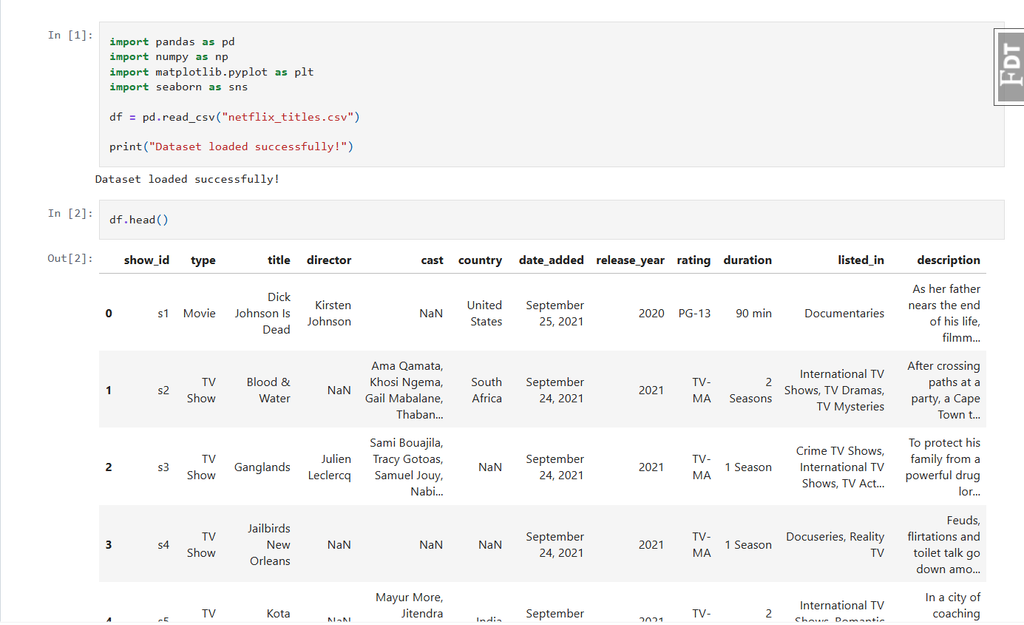
I started by importing the required libraries and loading the CSV dataset using Pandas.
I explored the dataset using functions such as head(), tail(), shape, dtypes, and info().
This helped me understand the dataset’s structure, number of records, column names, data types, and memory usage.
Step 2: Missing Value Analysis
One of the important parts of EDA is identifying missing information.
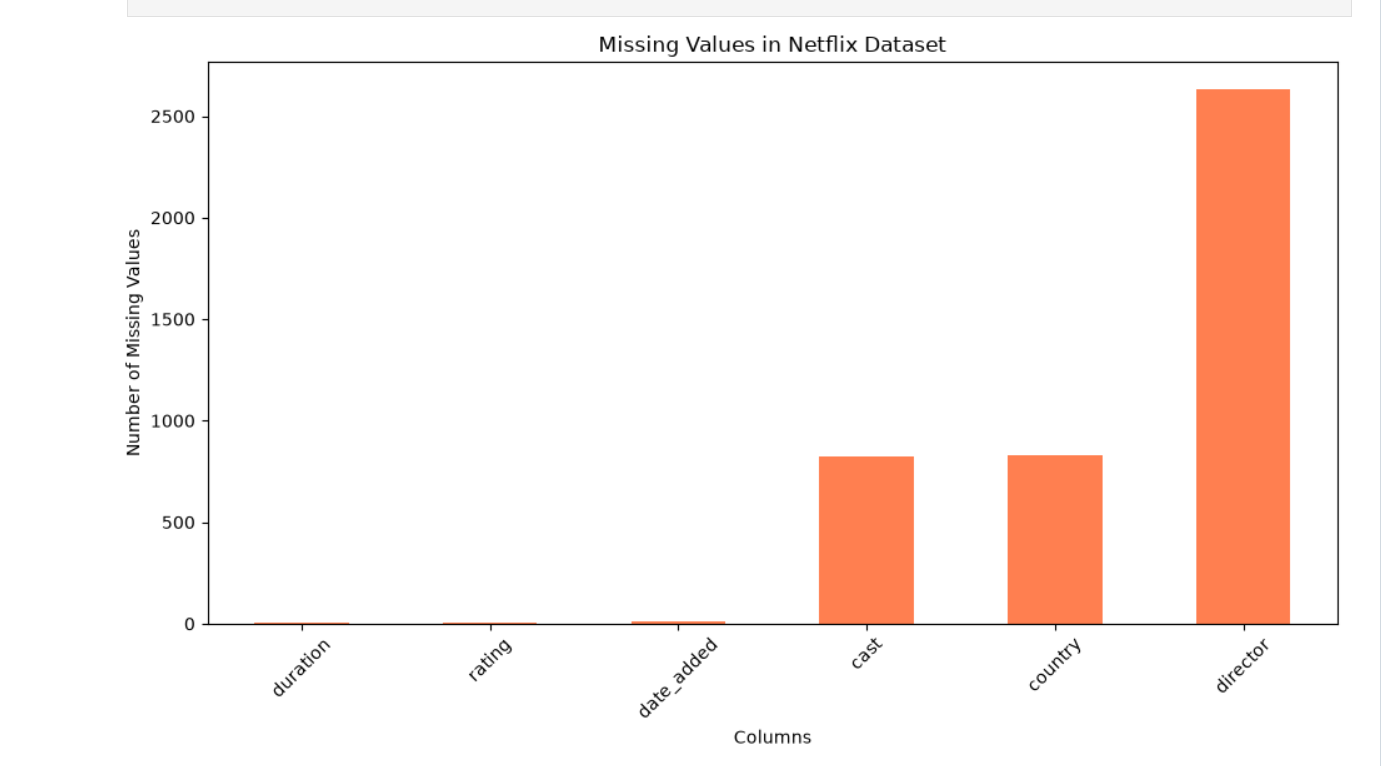
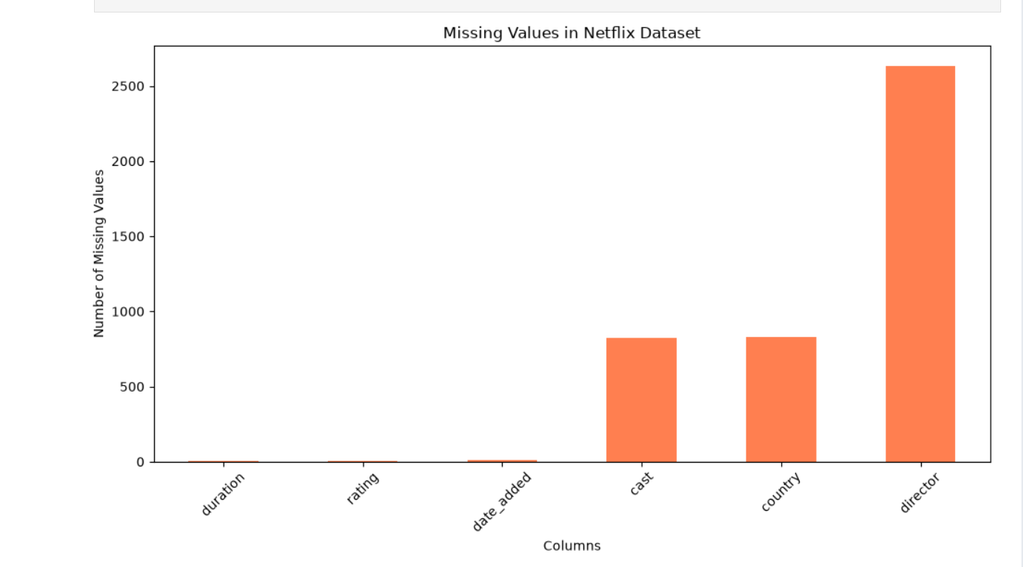
Using Pandas, I calculated the number and percentage of missing values in each column and created a bar chart to visualise them.
Some interesting observations:
- Director had 2,634 missing values (29.91%).
- Country had 831 missing values (9.44%).
- Cast had 825 missing values (9.37%).
This helped me understand the data quality issues that needed attention before further analysis.
Step 3: Summary Statistics
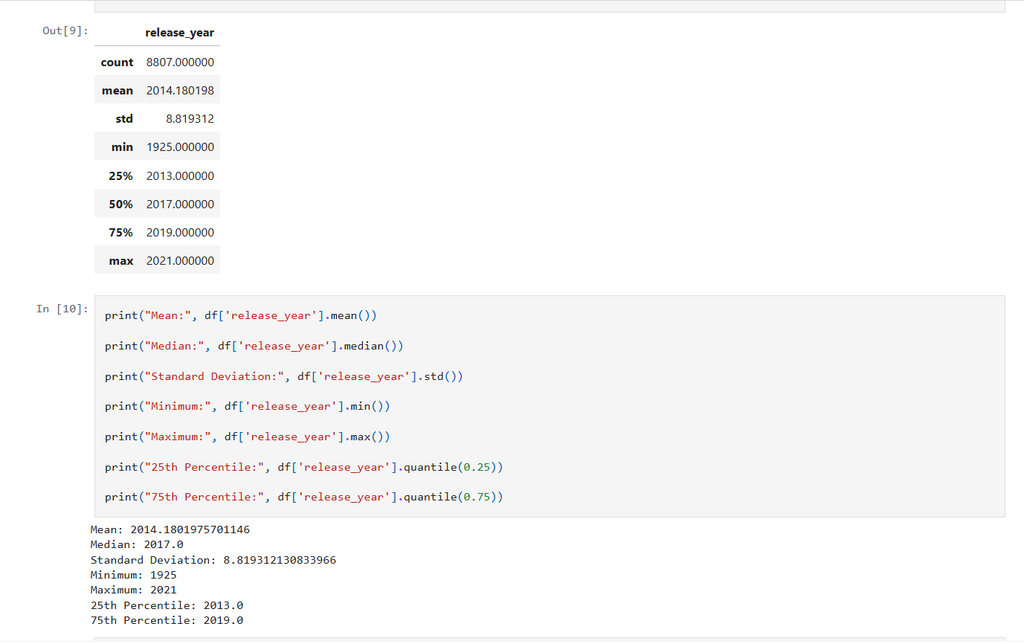
I explored numerical and categorical columns using Pandas functions such as describe() and value_counts().
I examined statistical measures including mean, median, standard deviation, and quartiles.
I also explored the distribution of content types, ratings, and countries.
Step 4: Data Visualisation
Visualisation helped me understand the dataset more effectively.
I created seven visualisations:
- Missing Values Distribution
- Movies vs TV Shows Distribution
- Content Rating Distribution
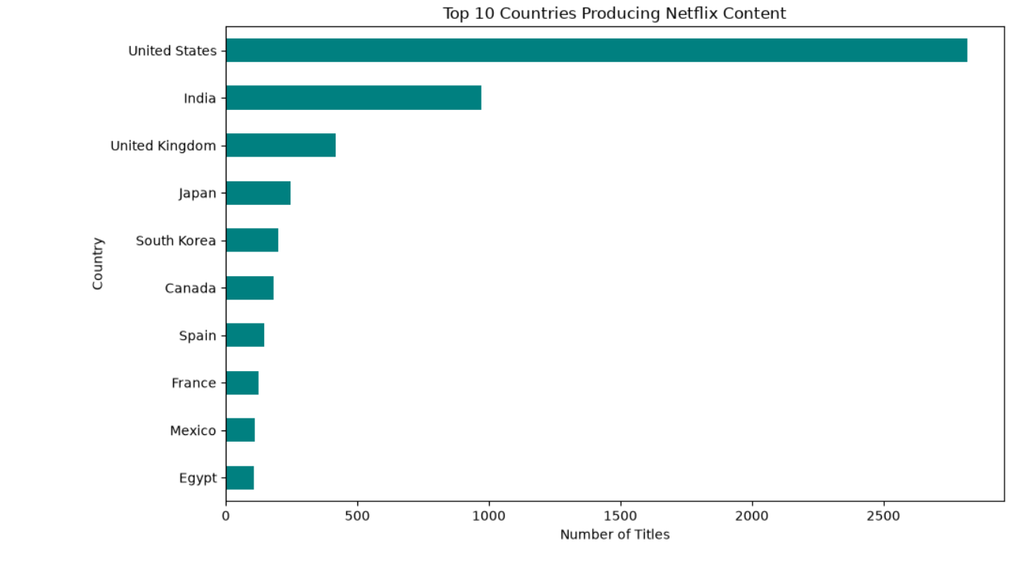
- Top 10 Countries Producing Netflix Content
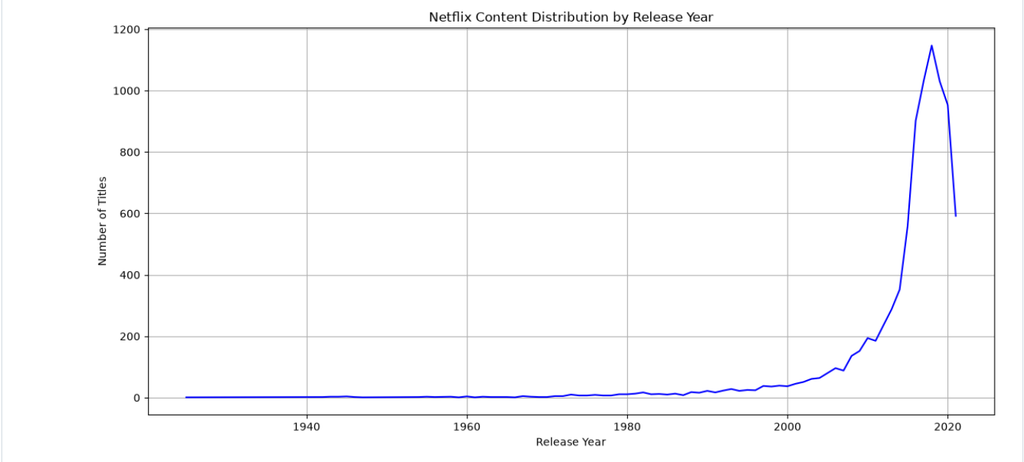
- Netflix Content Distribution by Release Year
- Top 10 Most Common Genres
- Distribution of Movie Durations
Each visualisation helped answer a specific question about the dataset and revealed patterns that were not immediately obvious from raw data.
4. Interesting Findings
Through this analysis, I discovered several interesting patterns:
- Content Distribution: Movies make up a larger portion of the dataset compared to TV shows.
- Missing Information: Director details have the highest percentage of missing values.
- Release Year Trends: The dataset shows a significant concentration of titles released after 2000, particularly around 2018.
- Popular Genres: International Movies, Dramas, and Comedies are among the most frequently listed categories.
- Movie Duration: Most movies have durations between approximately 80 and 120 minutes.
These findings helped me understand how data analysis can transform raw information into meaningful insights.
5. Key Learnings
This project gave me valuable hands-on experience with Python and data analysis.
Some of my key learnings include:
- Understanding how to load, inspect, and manipulate real-world datasets using Pandas.
- Identifying and analysing missing values.
- Applying statistical techniques to explore numerical and categorical data.
- Creating meaningful visualisations using Matplotlib and Seaborn.
- Interpreting charts and communicating findings through data.
Most importantly, I understood why EDA is an essential first step in every data science project.
6. Conclusion
Completing my first EDA project was a great learning experience. Working with a real-world Netflix dataset helped me move beyond theoretical concepts and apply Python libraries to an actual data analysis task.
This project strengthened my understanding of data exploration, statistical analysis, and visualisation. It also motivated me to continue learning and exploring more advanced areas of Data Science and Machine Learning.
I’m grateful to Valentius Kryptix for providing this opportunity to gain practical experience and improve my technical skills.
Explore My Project
The complete Jupyter Notebook, including Python code, analysis, and visualisations, is available on GitHub:
View My Netflix EDA Project on GitHub
Thank you for reading! More projects and learning experiences coming soon.
#Python #Pandas #DataScience #EDA #DataAnalysis #Matplotlib #Seaborn #Internship #ValentiusKryptix



Leave a Reply
You must be logged in to post a comment.