


Feature Selection in Machine Learning: Comparing SHAP, Feature Importance and RFECV
Feature selection is an important step in machine learning because having more features does not automatically mean having a better model. Unnecessary or less informative features can increase model complexity and make it harder to understand which variables are actually contributing to predictions.
As part of my Data Science internship at Valentius Kryptix, I worked on a Feature Selection and Explainability project using the Breast Cancer Wisconsin Diagnostic dataset and a Random Forest classifier. The main objective was to identify important features, compare different feature-selection techniques, and verify whether a reduced feature set could maintain or improve model performance.
Dataset and Preparation
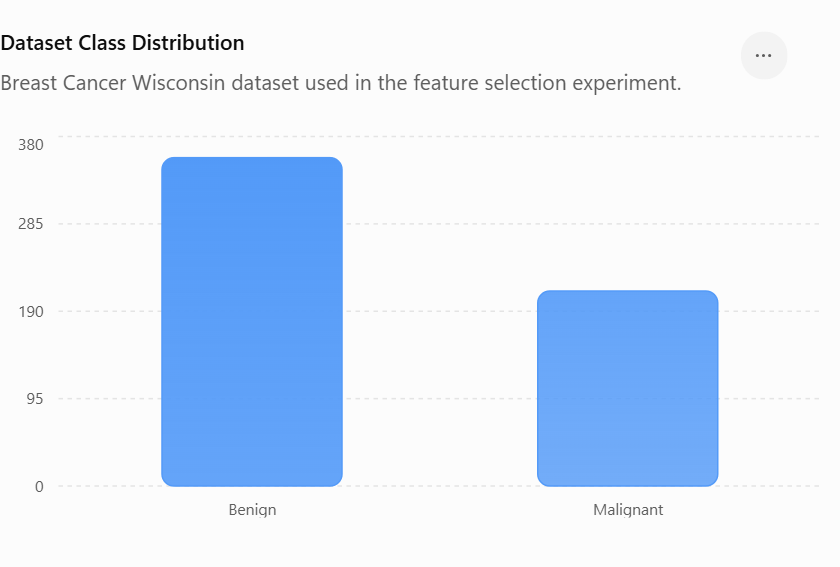
The dataset contains 569 samples and 30 predictive numerical features. The target variable is diagnosis, which was converted into a binary target where malignant cases were represented by 1 and benign cases by 0.
The original dataset also contained an ID column and an empty column, which were removed before modelling. The dataset had no missing values after preprocessing.
I divided the data into training and test sets using an 80:20 stratified split. This resulted in 455 training samples and 114 test samples. The test set was kept untouched for final evaluation.
Building the Baseline Model
I first trained a Random Forest classifier using all 30 available features. This model was used as the baseline so that the effect of feature selection could be measured objectively.
The baseline model achieved:
Accuracy: 96.49%
Precision: 100.00%
Recall: 90.48%
F1-Score: 95.00%
This provided a strong reference point for evaluating the reduced feature set.
Using SHAP for Explainability
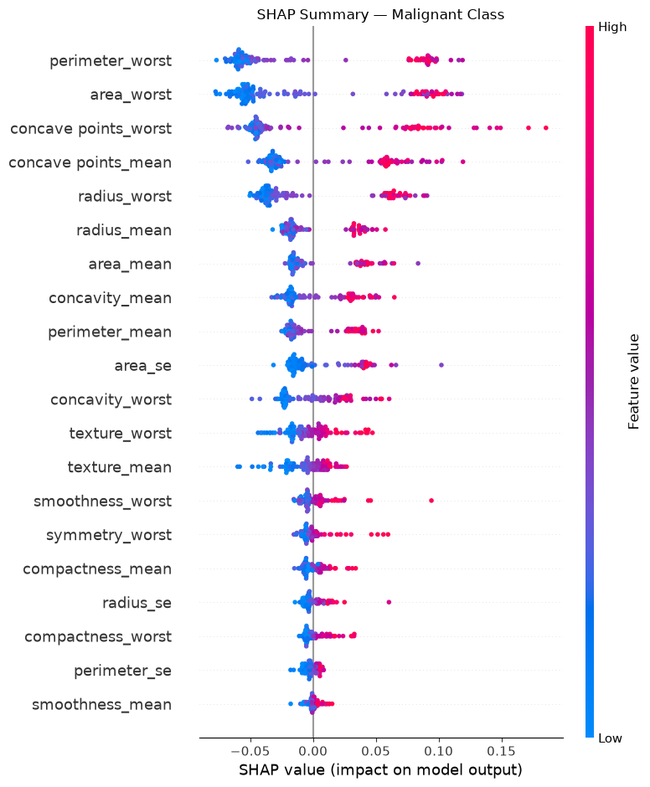
The first feature-analysis technique I used was SHAP (SHapley Additive exPlanations). SHAP helps explain how individual features contribute to a model’s predictions.
Using TreeExplainer with the Random Forest model, I calculated SHAP values for the test data and generated a SHAP summary plot.
The top features according to mean absolute SHAP importance included:
| Rank | Feature | SHAP Importance |
|---|---|---|
| 1 | perimeter_worst | 0.062206 |
| 2 | area_worst | 0.060218 |
| 3 | concave points_worst | 0.059386 |
| 4 | concave points_mean | 0.044048 |
| 5 | radius_worst | 0.043409 |
| 6 | radius_mean | 0.023587 |
| 7 | area_mean | 0.022834 |
| 8 | concavity_mean | 0.022427 |
| 9 | perimeter_mean | 0.021509 |
| 10 | area_se | 0.021369 |
- perimeter_worst
- area_worst
- concave points_worst
- concave points_mean
- radius_worst
- radius_mean
- area_mean
- concavity_mean
- perimeter_mean
- area_se
The SHAP summary plot was particularly useful because it showed both the importance of features and how their values influenced the model output.
Random Forest Built-in Feature Importance
| Rank | Feature |
|---|---|
| 1 | perimeter_worst |
| 2 | area_worst |
| 3 | concave points_worst |
| 4 | concave points_mean |
| 5 | radius_worst |
| 6 | radius_mean |
Next, I extracted the built-in feature_importances_ values from the Random Forest model.
An interesting observation was the strong agreement between SHAP and built-in feature importance. The top six features were exactly the same and appeared in the same order:
perimeter_worst
area_worst
concave points_worst
concave points_mean
radius_worst
radius_mean
Some lower-ranked features changed positions between the two approaches. This showed that different explanation methods can produce slightly different rankings even when they agree on the most important features.
Feature Selection with RFECV
The third approach was Recursive Feature Elimination with Cross-Validation, or RFECV.
RFECV repeatedly evaluates feature subsets and uses cross-validation to identify a suitable number of features. In this experiment, I used a Random Forest estimator, 5-fold cross-validation, F1-score as the evaluation metric, and a minimum of five features.
RFECV selected 29 out of the original 30 features.
The only feature removed was:
smoothness_se
This was an interesting result because smoothness_se also had relatively low importance in both the SHAP and built-in Random Forest rankings.
Testing the Reduced Feature Set
| Metric | Baseline RF | RFECV RF |
|---|---|---|
| Features | 30 | 29 |
| Accuracy | 96.49% | 97.37% |
| Precision | 100.00% | 100.00% |
| Recall | 90.48% | 92.86% |
| F1-Score | 95.00% | 96.30% |
After identifying the 29 selected features, I retrained another Random Forest model using only those features.
The reduced model achieved:
Accuracy: 97.37%
Precision: 100.00%
Recall: 92.86%
F1-Score: 96.30%
Compared with the baseline, the reduced model used one fewer feature while achieving higher performance on the held-out test set.
Model Comparison
Baseline Random Forest:
30 features
Accuracy: 96.49%
Precision: 100.00%
Recall: 90.48%
F1-Score: 95.00%
RFECV Random Forest:
29 features
Accuracy: 97.37%
Precision: 100.00%
Recall: 92.86%
F1-Score: 96.30%
The results show that removing smoothness_se did not reduce performance in this experiment. Instead, the reduced model achieved a higher F1-score than the full-feature baseline.
Key Learnings
The first important lesson was that feature selection should be validated rather than based only on intuition. A feature may appear useful, but its actual contribution should be evaluated using model-based techniques.
The second learning was that SHAP provides more than a simple feature ranking. It helps explain how feature values influence model predictions.
The third learning was that different feature-selection methods can agree on important features while producing different rankings for less influential variables. Comparing multiple approaches therefore provides a more complete understanding of the model.
Final Takeaway
The three approaches provided complementary information. SHAP explained feature contributions, Random Forest feature importance provided a fast model-based ranking, and RFECV directly selected a reduced feature subset.
In this experiment, the final RFECV feature set contained 29 features, with smoothness_se removed. The reduced model achieved an F1-score of 96.30%, compared with 95.00% for the baseline.
This project helped me understand that feature selection is not simply about deleting columns. It is about understanding model behaviour, validating the effect of removing features, and finding a simpler representation while maintaining strong predictive performance.
Project:
https://github.com/student-Madhumitakhatua/FeatureSelect-ExplainLab
Since the dataset is related to medical diagnosis, these results should be considered a machine-learning experiment rather than evidence for clinical deployment. Independent validation would be required before real-world use.

Leave a Reply
You must be logged in to post a comment.