

1. Introduction
In today’s data-driven world, organizations collect large amounts of data through their daily operations. However, raw data alone does not provide meaningful insights. It needs to be explored, analyzed, and interpreted to understand patterns, trends, and relationships. Exploratory Data Analysis (EDA) is an important step in the data analysis process that helps achieve this.
Exploratory Data Analysis involves examining datasets using statistical methods and visualizations to understand their structure, identify missing values, detect unusual observations, and discover useful patterns.
In this project, Python and its data analysis libraries were used to perform EDA on an Online Retail dataset. The analysis focuses on understanding transaction records, product information, quantities, prices, and country-wise sales activity.
2. Project Overview
The main objective of this project was to perform Exploratory Data Analysis on an Online Retail dataset using Python, Pandas, Matplotlib, and Seaborn.
The project involved inspecting the dataset, understanding its dimensions and data types, identifying missing values, calculating descriptive statistics, and creating visualizations to explore different aspects of retail transactions.
The analysis helps demonstrate how data analysis techniques can transform raw transaction records into meaningful information.
3. Dataset Description
The Online Retail dataset contains transaction-level information from an online retail business.
The dataset consists of 541,909 rows and 8 columns. These columns include:
- InvoiceNo: Unique invoice or transaction number.
- StockCode: Product identification code.
- Description: Description of the purchased product.
- Quantity: Number of items purchased.
- InvoiceDate: Date and time of the transaction.
- UnitPrice: Price per unit of the product.
- CustomerID: Identification number of the customer.
- Country: Country associated with the transaction.
This dataset provides information that can be used to explore purchasing patterns, product activity, and geographical transaction distribution.
4. Tools and Technologies Used
The following tools and libraries were used:
- Python: Programming language used for the analysis.
- Pandas: Used for data loading, inspection, manipulation, and statistical analysis.
- Matplotlib: Used to create charts and visual representations.
- Seaborn: Used to create statistical visualizations.
- Google Colab: Used as the development environment for executing the analysis.
5. Dataset Inspection
The first step was to load the dataset into a Pandas DataFrame and examine its structure.
Functions such as head(), shape, info(), and describe() were used to understand the dataset.
The dataset contained 541,909 transaction records and 8 columns. Examining data types and memory usage helped provide an overview of the dataset before performing further analysis.
6. Missing Value Analysis
Identifying missing values is an important part of data quality assessment.
The missing-value analysis identified:
- Description: 1,454 missing values.
- CustomerID: 135,080 missing values.
Approximately 24.93% of the CustomerID values were missing. This is an important observation because missing customer identifiers can limit customer-level analysis.
Understanding missing values helps determine the limitations of a dataset and the additional preprocessing that may be required.
7. Statistical Analysis
Descriptive statistics were calculated to understand numerical variables such as Quantity and UnitPrice.
Some observations from the analysis include:
- Average transaction quantity: approximately 9.55.
- Median transaction quantity: 3.
- Average unit price: approximately 4.61.
- Median unit price: approximately 2.08.
The difference between the mean and median values indicates that the distributions may be influenced by unusually large quantities or higher-priced products.
These statistics provide a useful starting point for understanding the numerical characteristics of the dataset.
8. Data Visualization and Exploratory Analysis
Data visualization helps communicate patterns that may not be immediately visible in raw data.
The following visualizations were created as part of this project:
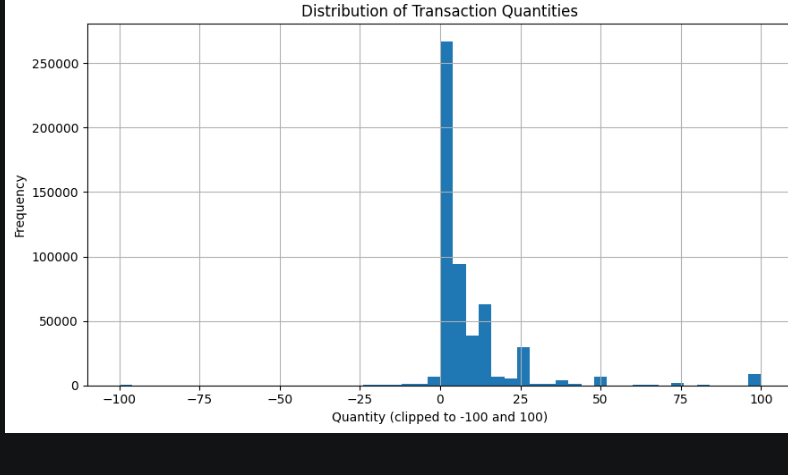
8.1 Distribution of Transaction Quantities
A histogram was used to examine the distribution of product quantities. The visualization helps understand common purchase quantities and variations in transaction sizes.
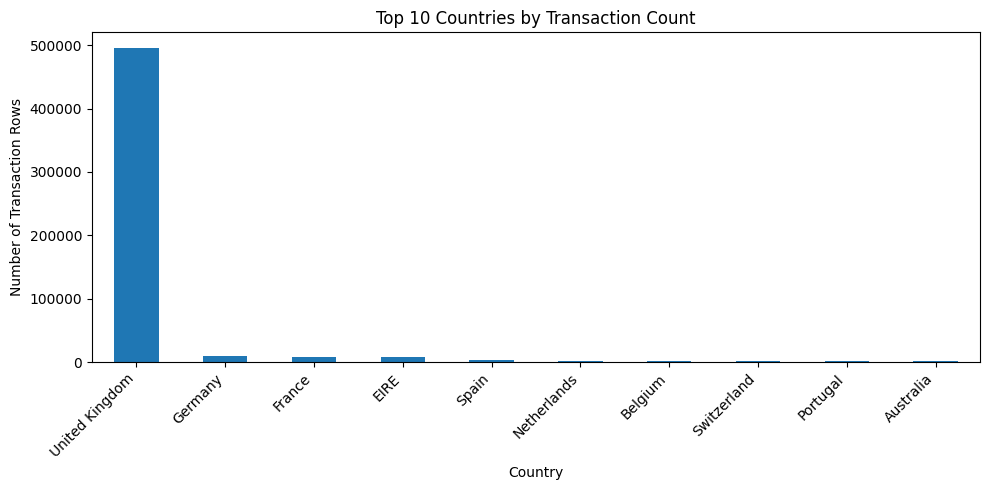
8.2 Top 10 Countries by Transaction Count
A bar chart was created to compare transaction records across countries. The United Kingdom had the highest number of transaction records among the 38 countries represented in the dataset.
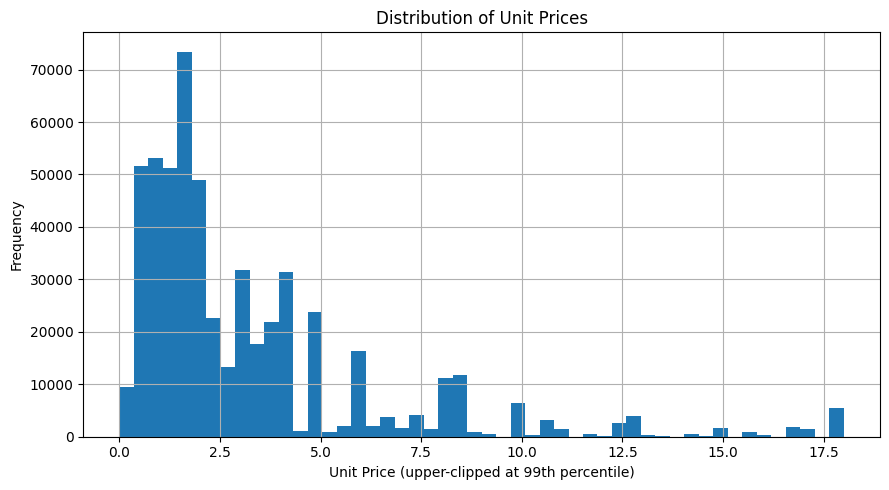
8.3 Distribution of Unit Prices
A histogram was used to explore product unit prices. This visualization helps understand the distribution of product pricing and identify variations between lower-priced and higher-priced products.
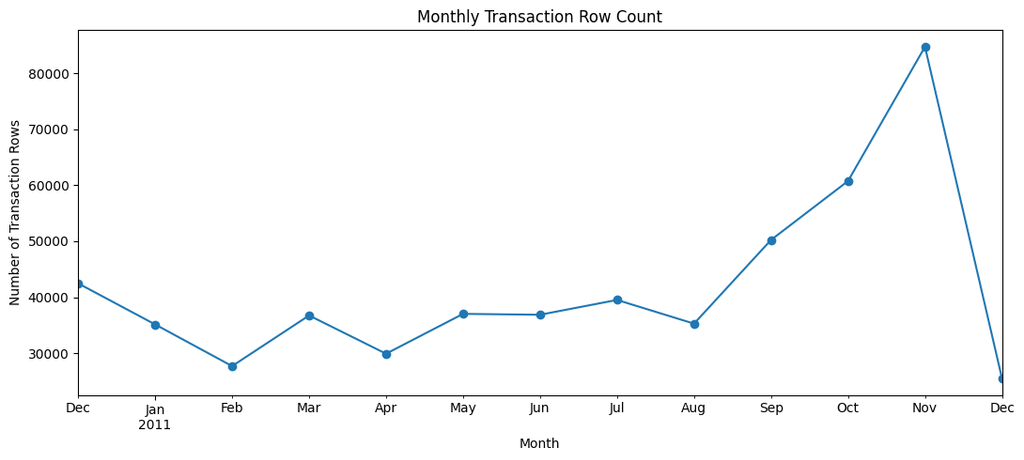
8.4 Monthly Transaction Trends
The transaction dates were converted into a datetime format to support time-based analysis. Monthly transaction counts were then visualized to explore changes in transaction activity over time.
8.5 Correlation Analysis
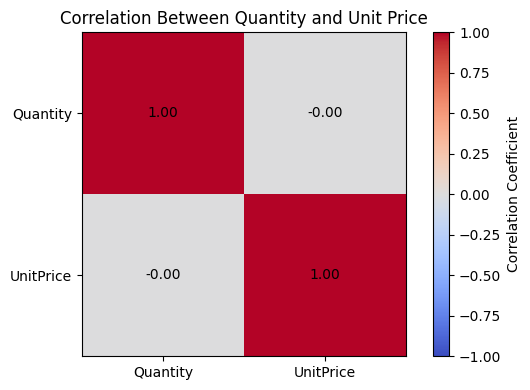
A correlation heatmap was created to examine the relationship between numerical variables such as Quantity and UnitPrice.
This visualization provides a quick overview of the correlation between the selected numerical features.
8.6 Top 10 Frequently Listed Products
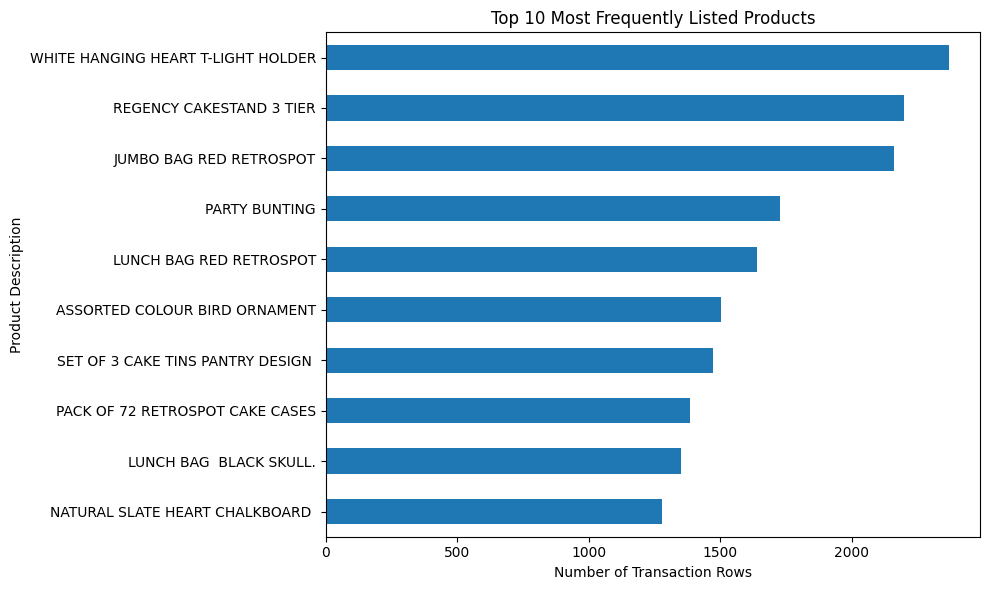
A bar chart was used to display the ten most frequently listed product descriptions. This helps identify products that appear most often in the transaction records.
9. Key Findings
The analysis provided several observations:
- The dataset contains 541,909 transaction records and 4,070 unique products.
- A total of 25,900 unique invoices were identified.
- The United Kingdom had the highest transaction count among the countries represented.
- The average quantity was higher than the median quantity, indicating the influence of larger transaction quantities.
- The average unit price was higher than the median unit price.
- Approximately 24.93% of CustomerID values were missing, which may affect customer-level analysis.
These findings demonstrate how exploratory analysis can help understand the characteristics and limitations of retail data.
10. Challenges and Learnings
During this project, I gained practical experience in working with a real-world dataset and understanding the importance of data quality.
Some of the key learnings included:
- Understanding dataset structure and data types using Pandas.
- Identifying and interpreting missing values.
- Calculating descriptive statistics.
- Exploring categorical and numerical variables.
- Creating meaningful visualizations using Matplotlib and Seaborn.
- Interpreting charts and statistical results to identify patterns.
The project also highlighted the importance of examining data before drawing conclusions from it.
11. Conclusion
This Exploratory Data Analysis project provided practical experience in analyzing an Online Retail dataset using Python and its data analysis libraries.
By examining dataset structure, identifying missing values, calculating statistical summaries, and creating visualizations, the project demonstrated how raw transaction data can be explored to discover useful patterns and observations.
Overall, the project strengthened my understanding of Python-based data analysis and the role of EDA in preparing datasets for further analytical tasks.


Leave a Reply
You must be logged in to post a comment.