

Introduction
In today’s digital world, large amounts of data are generated every second. However, raw data alone does not always provide useful information. Data visualisation helps transform complex datasets into meaningful visual representations such as charts, graphs, and dashboards. It makes information easier to understand, analyse, and communicate.
Data visualisation plays an important role in business intelligence and data analytics because it helps identify patterns, trends, relationships, and unusual observations. Instead of examining hundreds of individual records, users can understand important information through well-designed visualisations.
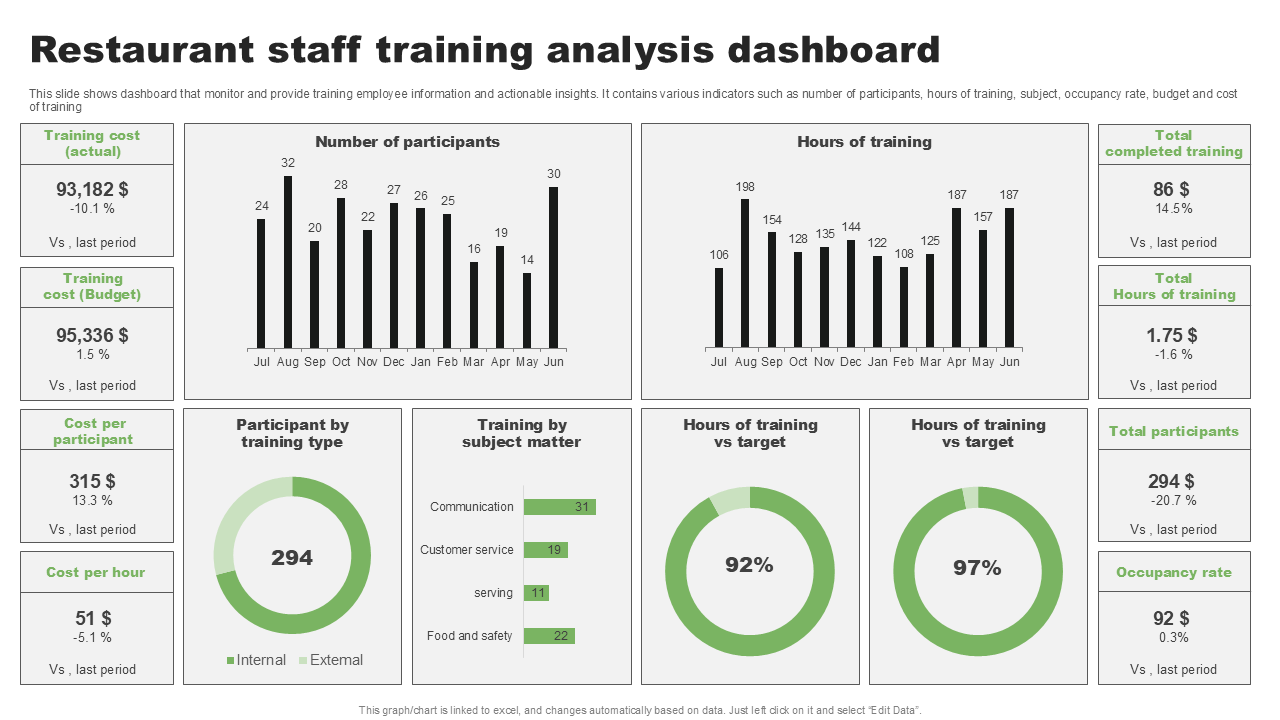
Project Overview: Restaurant Sales and Tipping Analytics Dashboard
As part of my Data Visualisation internship task at Valentius Kryptix, I worked on a Restaurant Sales and Tipping Analytics Dashboard using Python and Plotly.
The objective of this project was to explore restaurant transaction data and present useful insights through interactive charts and visual elements. The dashboard focuses on customer spending patterns, tipping behaviour, restaurant bills, and differences between lunch and dinner transactions.
The project uses the Plotly Tips Dataset, which contains 244 restaurant transaction records. By analysing this dataset, I explored how customers spend money, how tips vary across transactions, and how different factors relate to tipping behaviour.
Technologies Used
The project was developed using the following technologies:
- Python: Used as the primary programming language for data analysis and dashboard development.
- Pandas: Used to load, organise, filter, and manipulate the dataset.
- NumPy: Supported numerical operations and data processing.
- Plotly: Used to create interactive charts and visualisations.
- Google Colab: Provided the development environment for writing and executing Python code.
- IPyWidgets: Enabled interactive controls and filtering within the dashboard.
- HTML and CSS: Supported the presentation and styling of dashboard elements.
Data Analysis and Visualisation Techniques
Different visualisation techniques were used to understand the restaurant dataset.
1. Bar Chart
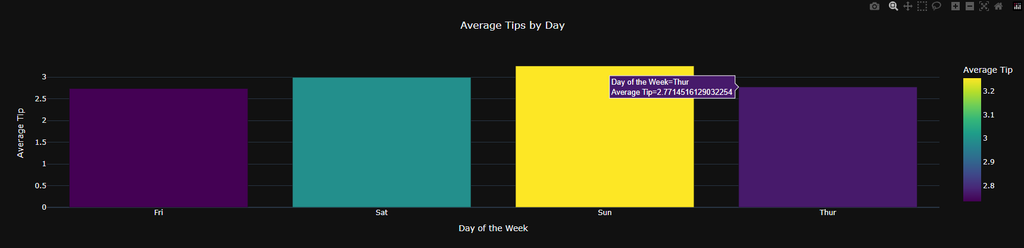
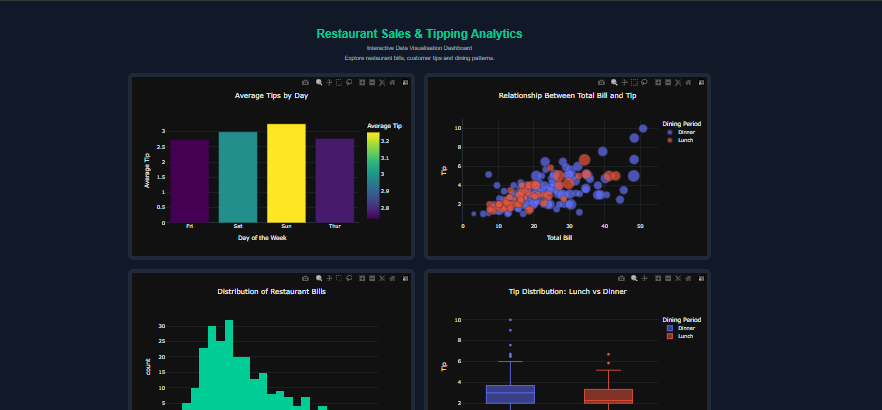
The bar chart was used to compare average tips across different days. It helps identify differences in customer tipping behaviour and makes comparisons between categories easier.
FriSatSunThur00.511.522.532.82.933.13.2Average TipAverage Tips by DayDay of the WeekAverage Tip
2. Scatter Plot
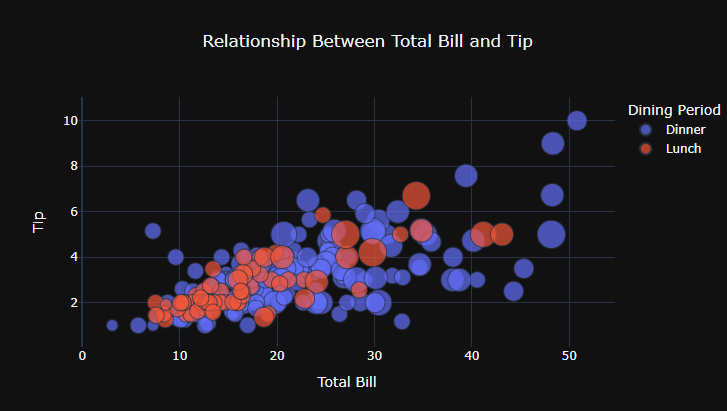
The scatter plot represents the relationship between the total bill and the tip amount. It helps examine whether customers with higher bills generally provide higher tips and highlights variations in tipping patterns.
3. Histogram
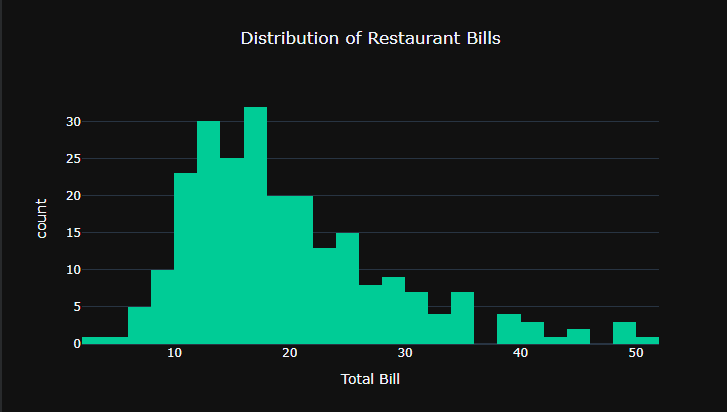
The histogram displays the distribution of restaurant bills. It helps identify common spending ranges and understand how frequently different bill amounts occur.
4. Box Plot
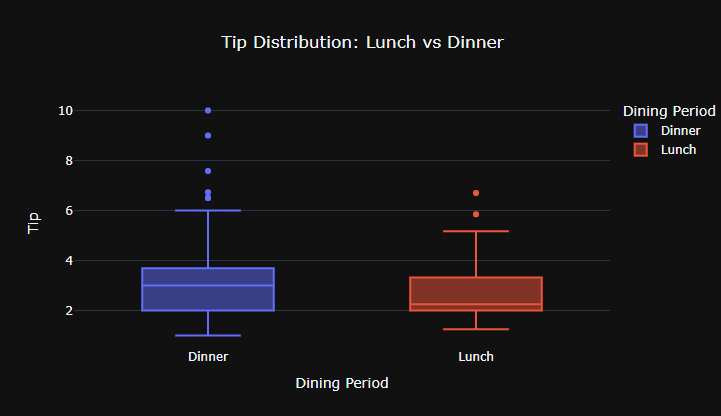
The box plot compares tip distributions between lunch and dinner transactions. It provides information about the median, spread, and potential outliers in the data.
5. Correlation Heatmap
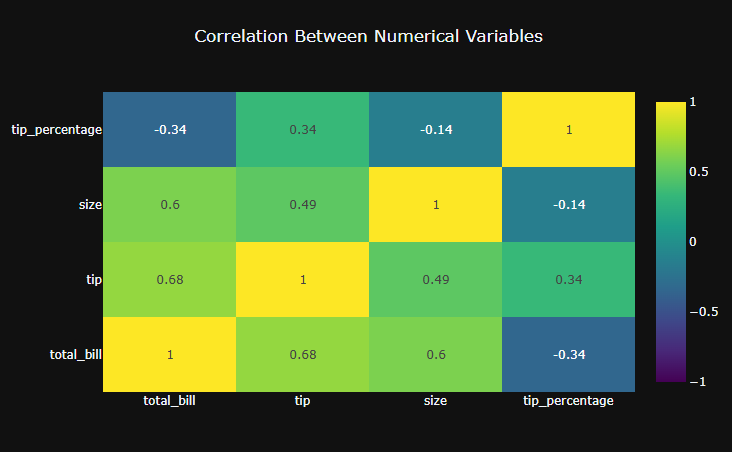
The correlation heatmap displays relationships between numerical variables. It helps identify positive and negative correlations and provides a quick overview of how different numerical attributes relate to each other.
Interactive Dashboard Features
An important part of the project is its interactive functionality. Instead of displaying only static charts, the dashboard allows users to explore the dataset through different controls.
The dashboard includes dropdown filters for day, dining period, and gender. These filters allow users to narrow down the data and observe how the visualisations change.
It also includes KPI cards that display important metrics such as total revenue, average bill, average tip, and transaction count.
Plotly’s interactive features allow users to hover over charts to view additional information, zoom into specific sections, pan across visualisations, and reset the chart view when required.
These features make the dashboard more useful because users can explore the data according to their interests instead of depending on a fixed report.
Key Learnings
Working on this project helped me understand several important aspects of data visualisation.
First, I gained practical experience in data preparation and analysis using Pandas and NumPy. I learned how to organise datasets and prepare information before creating visualisations.
Second, I understood how to select suitable chart types depending on the information being analysed. Different charts communicate different types of information, and choosing the correct visualisation improves clarity.
Third, I gained experience in creating interactive dashboards using Plotly and IPyWidgets. I learned how filters, KPI cards, and interactive chart controls can improve the overall user experience.
The project also improved my understanding of how data can support decision-making by presenting information in a clear and understandable format.
Conclusion
Data visualisation is an essential part of modern data analytics because it transforms raw information into meaningful insights. Through this Restaurant Sales and Tipping Analytics Dashboard, I explored how Python-based tools can be used to analyse restaurant transactions and communicate findings through interactive visualisations.
This project strengthened my practical understanding of data analysis, chart selection, and dashboard development. It also demonstrated how interactive data visualisation can make information more accessible and useful for decision-making.
I look forward to applying these skills to more real-world datasets and developing more advanced analytical dashboards.
Project Repository: https://github.com/SCM210305/Restaurant-Analytics-Dashboard

Leave a Reply
You must be logged in to post a comment.