

Introduction
In today’s data-driven world, data visualisation plays an important role in helping businesses understand complex information and make better decisions. Organisations collect large amounts of data about customers, products, sales, financial transactions, and market trends. However, raw data alone cannot always explain what is happening in a business. Data must be cleaned, analysed, and presented in a meaningful way to uncover useful insights.

As part of my data analytics learning journey, I worked on an Automobile Exploratory Data Analysis (EDA) project using Python. The main objective of this project was to explore automobile customer data, understand its characteristics, and identify meaningful patterns through data analysis and visualisation.
In this article, I will explain how data visualisation supports exploratory data analysis, the tools used in my project, and how visual representations can help transform raw automobile data into useful business insights.
What Is Data Visualisation?
Data visualisation is the process of presenting information through charts, graphs, plots, and other visual elements. It makes complex datasets easier to understand by highlighting patterns, relationships, distributions, and unusual observations.
For example, a table containing hundreds of automobile customer records may be difficult to interpret. A well-designed chart can make it easier to understand the distribution of customer characteristics or examine relationships between financial variables and customer preferences.
For data analysts, visualisation is not simply about creating attractive charts. It is about answering business questions and communicating findings clearly.
Overview of My Automobile EDA Project
My Automobile EDA project focuses on exploring automobile customer data using Python libraries. The project includes data cleaning, preprocessing, and exploratory analysis at different levels.
The main tools used in this project are:
- Python: Used to perform data analysis and organise the analytical workflow.
- Pandas: Used for loading, manipulating, cleaning, and exploring tabular data.
- NumPy: Used for numerical operations and working with numerical data.
- Matplotlib: Used to create charts and visualise patterns in the dataset.
- Seaborn: Used to create statistical visualisations and explore relationships between variables.
The project follows an important principle of data analytics: before drawing conclusions, it is necessary to understand the dataset, check its quality, and investigate its underlying patterns.
Why Is Data Visualisation Important in EDA?
Exploratory Data Analysis, commonly known as EDA, helps analysts understand a dataset before performing deeper analysis or building predictive models. Data visualisation makes this process more effective.
In my automobile analysis project, visualisation supports three major types of exploration.
1. Univariate Analysis
Univariate analysis focuses on one variable at a time. It helps an analyst understand the distribution and characteristics of individual columns.
Histograms can help examine the distribution of numerical variables, while count plots or bar charts can show the frequency of categories. These visualisations help identify common values, uneven distributions, and potential unusual observations.
For automobile customer data, this type of analysis can be used to explore individual customer characteristics and financial variables, depending on the columns available in the dataset
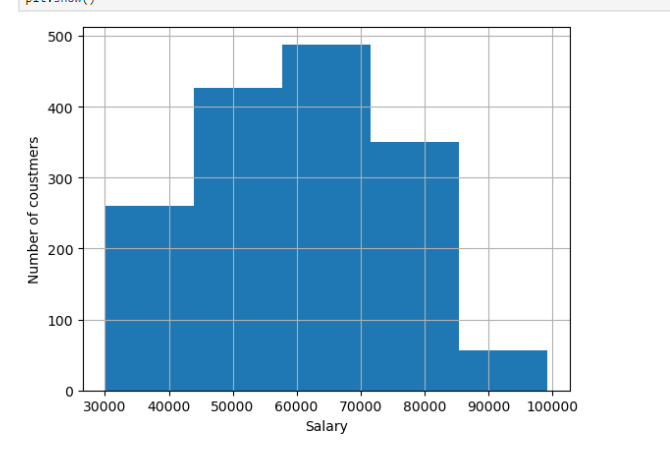
This histogram shows the distribution of customers across different salary ranges. The X-axis represents salary, while the Y-axis represents the number of customers.
The graph shows that the highest number of customers, approximately 490, fall within the salary range of ₹60,000–₹70,000. In contrast, only around 60 customers fall within the ₹85,000–₹1,00,000 range.
Overall, most customers have salaries in the middle range, while relatively few customers belong to the highest salary range.
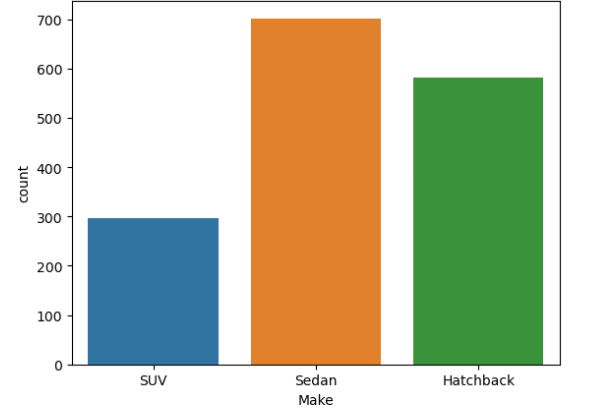
This bar chart shows the distribution of customers across three automobile types: SUV, Sedan, and Hatchback. The X-axis represents the automobile type, while the Y-axis represents the number of customers.
The chart shows that Sedan is the most popular type, with approximately 700 customers, followed by Hatchback with around 580 customers. SUV has the lowest number of customers, at approximately 300.
Overall, the chart indicates that customers prefer Sedans and Hatchbacks over SUVs in this dataset.
2. Bivariate Analysis
Bivariate analysis examines the relationship between two variables. It helps answer questions about how one characteristic may vary with another.
For example, a scatter plot can help investigate the relationship between two numerical variables, while grouped bar charts can compare a numerical measure across different categories.
In an automobile dataset, these techniques can help explore possible relationships between customer characteristics, financial patterns, and car preferences. Such relationships can guide further investigation, although a visual correlation does not necessarily prove causation.
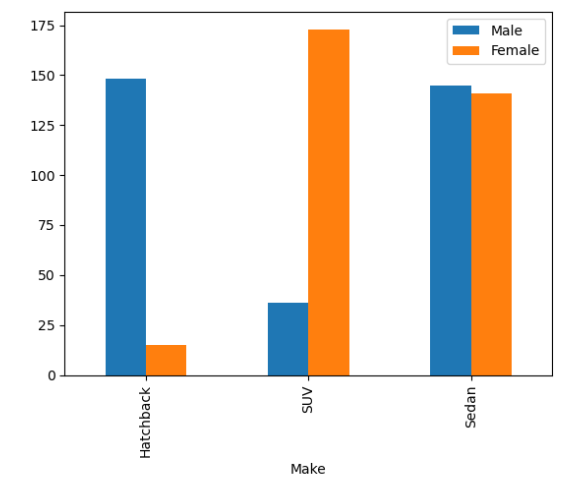
This grouped bar chart compares the number of male and female customers across three automobile types: Hatchback, SUV, and Sedan.
For Hatchbacks, male customers are significantly higher, at approximately 148, compared to around 15 female customers. For SUVs, female customers dominate, with approximately 172 customers, while male customers account for around 36. For Sedans, the numbers of male and female customers are nearly equal, at approximately 145 and 140, respectively.
Overall, the chart shows that male customers are more concentrated in Hatchbacks, female customers prefer SUVs in this dataset, and Sedans have a nearly balanced gender distribution.
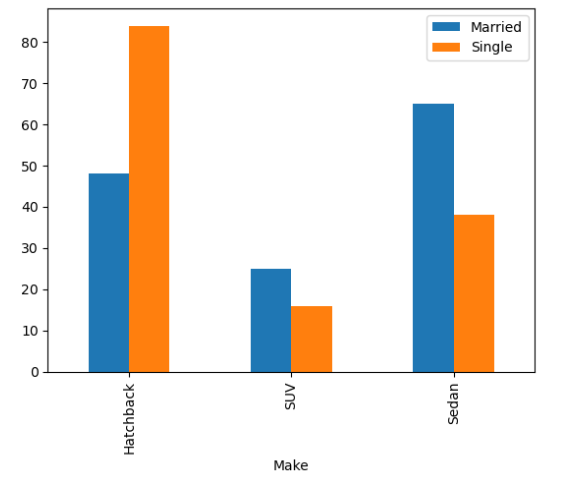
This grouped bar chart compares the number of married and single customers across three automobile types: Hatchback, SUV, and Sedan.
For Hatchbacks, single customers are higher, at approximately 84, compared to around 48 married customers. For SUVs, married customers are slightly higher, at approximately 25, while single customers account for around 16. For Sedans, married customers dominate, with approximately 65 customers compared to around 38 single customers.
Overall, the chart shows that single customers are more concentrated in Hatchbacks, while married customers are more represented among Sedan buyers. SUV customers are comparatively fewer in both groups.
3. Multivariate Analysis
Multivariate analysis involves examining multiple variables together. Real-world business problems often depend on several factors rather than a single variable.
Visualisation techniques such as correlation heatmaps can help analysts examine relationships among multiple numerical variables simultaneously. These charts make it easier to identify groups of related variables and potential patterns that may require further analysis.
Using multivariate exploration can provide a broader understanding of the dataset and help analysts formulate better questions.
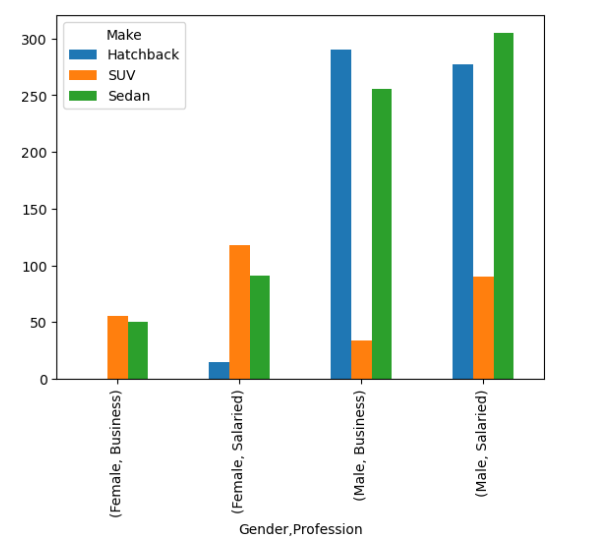
This grouped bar chart compares the number of customers across three automobile types—Hatchback, SUV, and Sedan—based on gender and profession.
Among female business customers, SUVs have the highest count at approximately 55, followed by Sedans at around 50, while Hatchbacks have almost no customers. Among female salaried customers, SUVs lead with approximately 118 customers, followed by Sedans at around 92 and Hatchbacks at around 15.
For male business customers, Hatchbacks have the highest count at approximately 290, followed by Sedans at around 255 and SUVs at around 35. Among male salaried customers, Sedans lead with approximately 305 customers, followed by Hatchbacks at around 278 and SUVs at around 90.
Overall, the chart shows that male customers account for higher counts across most automobile categories, with Hatchbacks popular among male business customers and Sedans leading among male salaried customers.
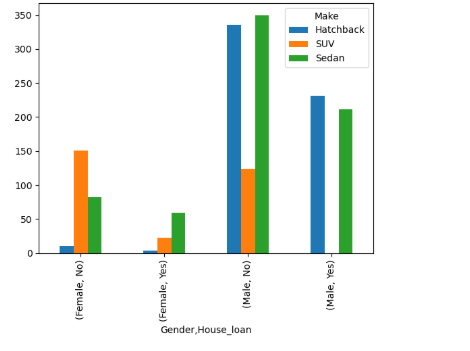
This grouped bar chart compares the number of customers across three automobile types—Hatchback, SUV, and Sedan—based on gender and profession.
Among female business customers, SUVs have the highest count at approximately 55, followed by Sedans at around 50, while Hatchbacks have almost no customers. Among female salaried customers, SUVs lead with approximately 118 customers, followed by Sedans at around 92 and Hatchbacks at around 15.
For male business customers, Hatchbacks have the highest count at approximately 290, followed by Sedans at around 255 and SUVs at around 35. Among male salaried customers, Sedans lead with approximately 305 customers, followed by Hatchbacks at around 278 and SUVs at around 90.
Overall, the chart shows that male customers account for higher counts across most automobile categories, with Hatchbacks popular among male business customers and Sedans leading among male salaried customers.
Data Cleaning Before Visualisation
One of the most important lessons in data analytics is that the quality of a visualisation depends on the quality of its underlying data.
If a dataset contains missing values, duplicate records, inconsistent data types, or incorrect entries, the resulting charts may be misleading. Therefore, data cleaning and preprocessing are important steps before interpreting visual patterns.
Python and Pandas provide useful functionality for inspecting data types, checking missing values, identifying duplicates, and preparing data for analysis.
After examining the data quality, an analyst can decide how to handle the issues based on the dataset and the analytical objective. This makes the visualisation process more reliable and helps prevent incorrect conclusions.
How Data Visualisation Supports Business Decisions
Automobile businesses can use data visualisation to understand customers, evaluate market patterns, and support strategic decisions.
For example, a business could use customer data to investigate which customer segments show particular preferences, how financial characteristics vary across groups, or whether certain variables appear to be related.
A dashboard or collection of clear charts could help business teams explore these questions more efficiently than reviewing raw data alone.
The actual business value comes from connecting the visual findings to a relevant question. Instead of simply presenting a chart, an analyst should explain what it shows, why it matters, and what additional analysis may be needed before taking action.
My Automobile EDA project demonstrates how Python-based exploratory analysis and visualisation can be combined to investigate data systematically.
Key Learnings from My Project
Working on an EDA project is a valuable way to develop practical data analytics skills. My Automobile EDA project brings together Python, Pandas, NumPy, Matplotlib, and Seaborn in a structured analytical workflow.
It reinforces the importance of understanding data before interpreting it, preparing datasets carefully, and using suitable visualisation techniques to investigate patterns.
It also highlights a broader lesson: data analysis is not only about writing code or generating charts. An effective analyst must be able to connect technical findings with meaningful questions and explain those findings in a way that others can understand.
Conclusion
Data visualisation is an essential part of modern data analytics because it helps transform raw information into understandable and actionable insights. When combined with data cleaning and exploratory analysis, it allows analysts to examine distributions, investigate relationships, and discover patterns that may otherwise remain hidden.
Through my Automobile EDA project, I explored how Python libraries such as Pandas, NumPy, Matplotlib, and Seaborn support the process of understanding and visualising automobile customer data.
For aspiring data analysts, developing these skills is an important step towards solving real-world business problems. The ultimate goal is not simply to create charts, but to use data visualisation to ask better questions, communicate findings clearly, and support informed decision-making.
Project Repository: https://github.com/sccitecchabhi/AutoMobile-EDA

Leave a Reply
You must be logged in to post a comment.