

1. Introduction
Statistical Analysis is an important part of data science that helps transform raw data into meaningful insights. It involves collecting, organizing, analyzing, and interpreting data to identify patterns, relationships, and differences between variables.
During my internship at Valentius Kryptix, I worked on a Statistical Analysis project to understand how statistical techniques can be applied to real-world datasets. The project focused on exploratory data analysis and hypothesis testing using Python.
2. Objective of the Project
The main objective was to analyze a real-world dataset, understand its patterns, and apply statistical hypothesis testing to determine whether there was a significant difference between two groups.
The project helped demonstrate how data-driven decisions can be supported by statistical evidence rather than assumptions.
3. Dataset Description
For this project, I used the Tips dataset, which contains information about restaurant bills and customer tips.
The dataset includes variables such as:
- Total bill amount
- Tip amount
- Gender
- Smoking status
- Day of the week
- Time of the meal (Lunch or Dinner)
- Number of people in the group
This dataset provides an opportunity to explore customer tipping behavior and identify patterns across different categories.
4. Data Cleaning and Preprocessing
Before performing statistical analysis, I examined the dataset to understand its structure and quality.
Using Python and Pandas, I performed:
- Dataset inspection
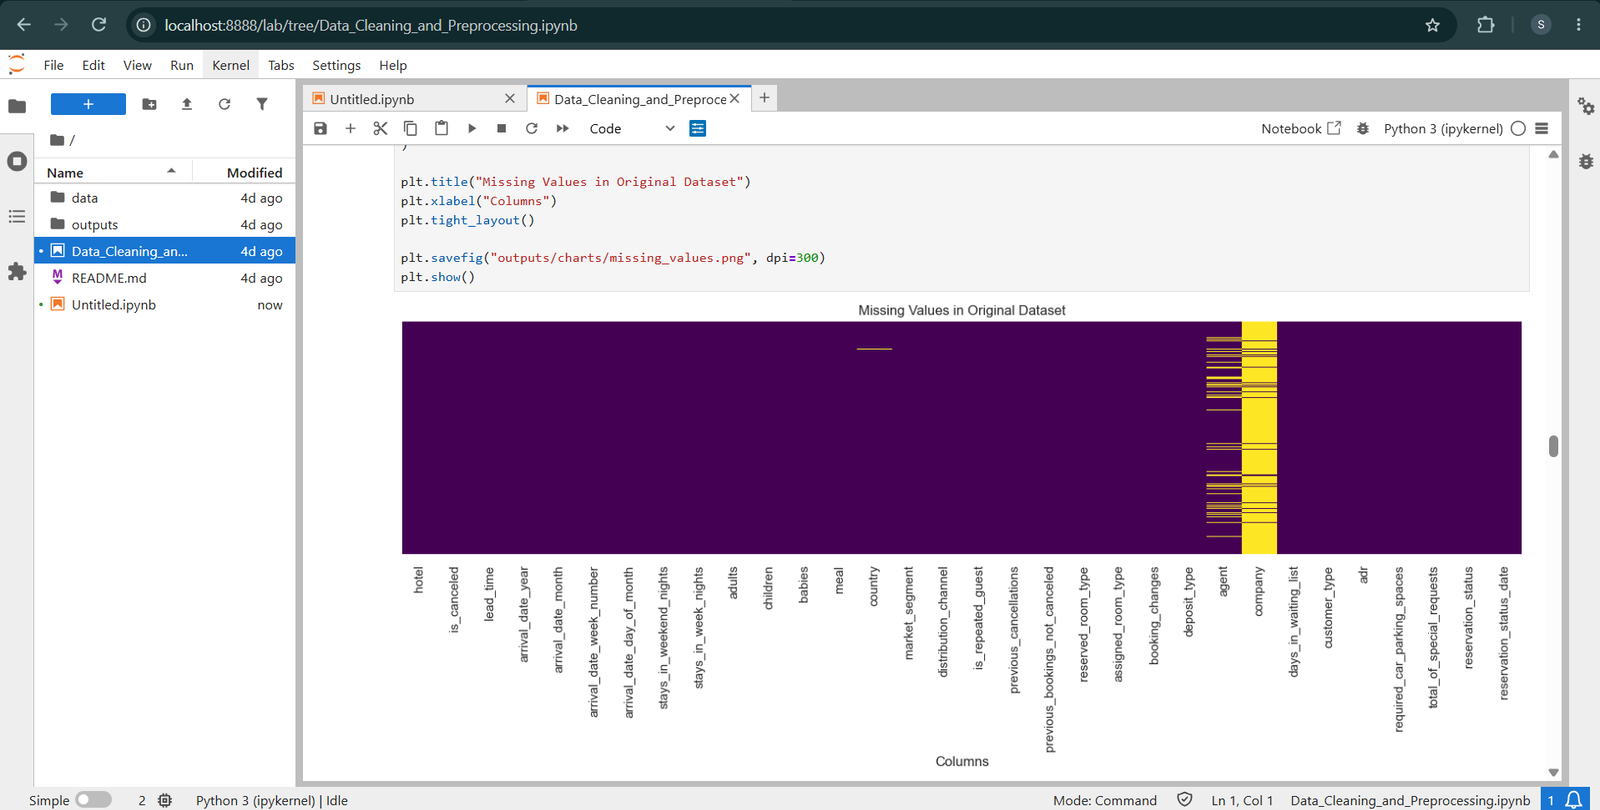
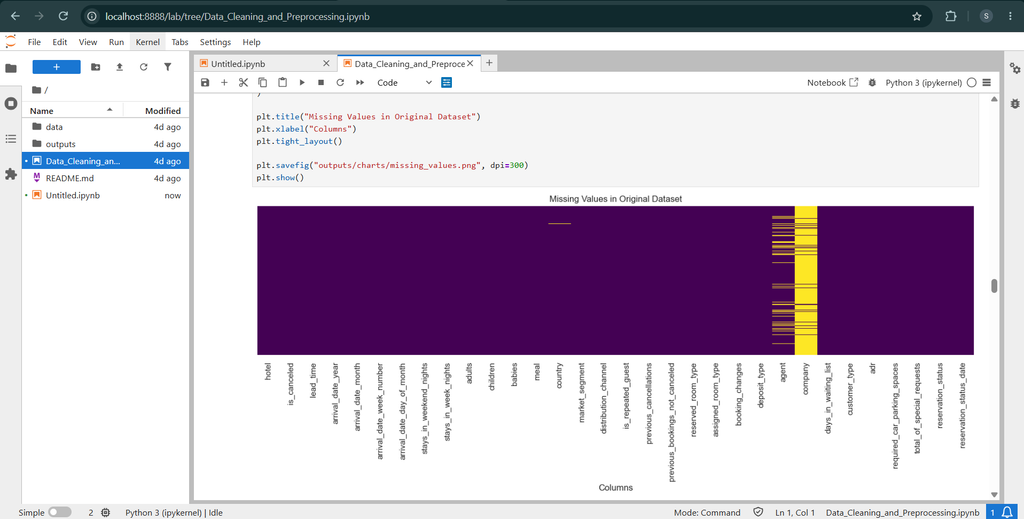
- Checking for missing values
- Identifying duplicate records
- Reviewing column data types
- Preparing relevant variables for analysis
Data preprocessing is essential because accurate analysis depends on reliable and properly structured data.
5. Exploratory Data Analysis
Exploratory Data Analysis (EDA) helps understand the characteristics of a dataset through statistical summaries and visualizations.
I used Python libraries such as Pandas, Matplotlib, and Seaborn to explore the dataset.
The analysis included:
- Calculating average tip amounts
- Comparing lunch and dinner transactions
- Studying the distribution of tips
- Creating visualizations to identify patterns
Charts and graphs made it easier to understand the differences between groups and communicate the findings.
6. Hypothesis Formulation
The main statistical question was whether the average tip amount differs between lunch and dinner transactions.
I formulated two hypotheses:
Null Hypothesis (H0): There is no significant difference in the average tip amount between lunch and dinner transactions.
Alternative Hypothesis (H1): There is a significant difference in the average tip amount between lunch and dinner transactions.
A significance level of 0.05 (5%) was selected for the test.
7. Statistical Testing Using Python
To evaluate the hypotheses, I used an independent two-sample t-test.
The test compares the average values of two independent groups and helps determine whether the observed difference is statistically significant.
Python libraries such as SciPy and Pandas were used to calculate the test results.
The test produced the following results:
- T-statistic: -2.0593
- P-value: 0.04126
- Significance level: 0.05
8. Results and Interpretation
The calculated p-value was approximately 0.04126, which is less than the selected significance level of 0.05.
Therefore, I rejected the null hypothesis.
This provides statistically significant evidence of a difference in average tip amounts between lunch and dinner transactions in the analyzed sample.
It is important to note that statistical significance does not automatically establish causation.
9. Key Learnings
Through this project, I gained practical experience in:
- Data cleaning and preprocessing using Pandas.
- Exploratory Data Analysis using Matplotlib and Seaborn.
- Understanding null and alternative hypotheses.
- Applying independent two-sample t-tests.
- Interpreting p-values and statistical significance.
- Communicating findings through charts and reports.
10. Conclusion
This Statistical Analysis project provided practical experience in applying statistical methods to real-world data.
By combining data preprocessing, exploratory analysis, visualization, and hypothesis testing, I was able to investigate differences in customer tipping behavior between lunch and dinner transactions.
The project strengthened my understanding of Python-based statistical analysis and demonstrated the importance of using statistical evidence to support data-driven conclusions.
Project Repository: https://github.com/Suhail7893/Statistical_Analysis_Reports
Internship: Valentius Kryptix
Data visualization


Leave a Reply
You must be logged in to post a comment.