

Introduction
During my internship at Valentius Kryptix, I worked on a Machine Learning fundamentals project where I implemented Linear Regression from scratch using NumPy. Instead of directly using ready-made Machine Learning libraries, the goal was to understand how a model actually learns from data.
Before starting this project, I knew how to use Machine Learning libraries such as Scikit-Learn. However, I did not fully understand what happens internally when a model is trained. This project gave me an opportunity to explore the mathematical concepts behind prediction, error calculation, optimization, and model evaluation.
Rather than treating Machine Learning as a black box, I learned how each component works together to produce meaningful predictions.
Why I Chose to Build It from Scratch
Most beginners start Machine Learning by importing a library and calling a few functions. While that approach is useful, it often hides the actual learning process.
I wanted to understand:
- How predictions are generated
- How model parameters are updated
- How errors are calculated
- Why Gradient Descent works
- How optimization improves model performance
Implementing everything manually helped me gain a much deeper understanding of these concepts.
Working with the California Housing Dataset
For this project, I used the California Housing Dataset, which contains information related to housing characteristics and house values.
Some of the features included:
- Median Income
- House Age
- Average Rooms
- Average Bedrooms
- Population
- Average Occupancy
- Latitude
- Longitude
The target variable was the median house value.
Working with a real-world dataset helped me understand that Machine Learning is not only about writing algorithms but also about preparing and understanding data.
The Importance of Data Preparation
One of the first things I learned was that data preparation is a critical step.
Before training the model, I:
- Loaded the dataset
- Checked for missing values
- Selected input features and target values
- Split the dataset into training and testing sets
I used approximately:
- 80% data for training
- 20% data for testing
This helped ensure that the model was evaluated on unseen data rather than the same data used during training.
Understanding Feature Standardization
Initially, I noticed that different features had completely different scales.
For example:
- Income values were relatively small
- Population values were much larger
- Latitude and longitude had different ranges
Without standardization, Gradient Descent can become unstable and converge slowly.
To solve this problem, I standardized the features using the mean and standard deviation of the training data.
This was one of the first moments where I realized that proper preprocessing can significantly impact model performance.
Implementing the Hypothesis Function
The hypothesis function is responsible for generating predictions.
Instead of relying on library functions, I implemented it using NumPy matrix operations.
This helped me understand how Machine Learning models perform calculations efficiently on thousands of observations simultaneously.
I also gained practical experience with:
- Matrix multiplication
- Vectorized operations
- NumPy arrays
These skills are extremely useful in Data Science and Machine Learning projects.
Learning Through the Cost Function
After generating predictions, the next step was measuring prediction error.
I implemented the Mean Squared Error-based cost function manually.
At first, it seemed like a simple formula. However, seeing how the cost value changed during training helped me understand its importance.
The cost function acts like a scorecard for the model. A lower cost indicates better predictions.
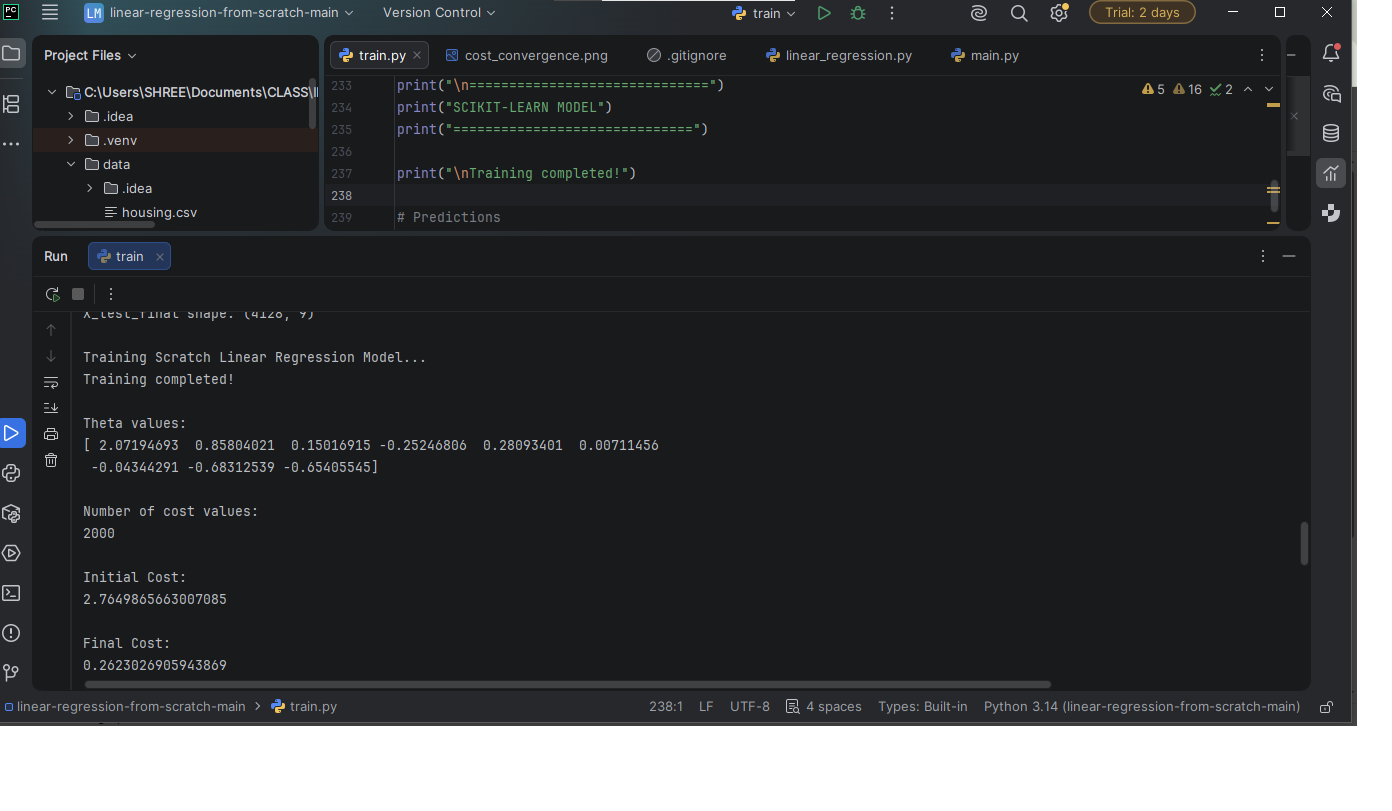
Watching the cost decrease after every iteration was one of the most satisfying parts of the project.
Understanding Gradient Descent
Gradient Descent was the concept that taught me the most.
Initially, the mathematical equations looked intimidating.
However, once I implemented them step by step, the idea became much clearer.
The process was simple:
- Generate predictions
- Calculate errors
- Compute gradients
- Update parameters
- Repeat
With each iteration, the model gradually improved its predictions.
Seeing this learning process happen through code made Machine Learning feel much less mysterious.
Tracking Cost Convergence
One of the most interesting parts of the project was plotting the cost convergence graph.
The graph showed how the cost decreased as training progressed.
This visualization helped me understand:
- Whether the model was learning correctly
- Whether the learning rate was appropriate
- Whether Gradient Descent was converging
Instead of blindly trusting the algorithm, I could actually observe the learning process.
Evaluating Model Performance
After training, I evaluated the model using:
Mean Squared Error (MSE)
MSE measures the average prediction error.
A lower value generally indicates better performance.
R² Score
R² measures how much variation in the target variable is explained by the model.
Calculating these metrics manually helped me understand what these evaluation scores actually represent.
Comparing with Scikit-Learn
Once my implementation was complete, I trained a Scikit-Learn Linear Regression model using the same dataset.
The purpose was not to replace my implementation but to verify it.
I compared:
- Predictions
- Coefficients
- MSE
- R² Score
The results were very similar, which confirmed that the model I built from scratch was working correctly.
This comparison gave me confidence in my implementation and helped validate my understanding of Linear Regression.
Key Lessons from This Project
This project taught me much more than just Linear Regression.
Some important lessons I learned include:
- Data preparation is essential.
- Feature scaling improves optimization.
- Matrix operations are powerful.
- Gradient Descent is easier to understand through implementation.
- Evaluation metrics are meaningful only when you understand how they are calculated.
- Visualizing training progress helps identify problems early.
Most importantly, I learned that Machine Learning algorithms are not magic. They are built on mathematical concepts that can be understood step by step.
Conclusion
Building Linear Regression from scratch using NumPy was one of the most valuable learning experiences during my internship at Valentius Kryptix.
Instead of simply using a library, I implemented prediction generation, cost calculation, gradient computation, parameter updates, and model evaluation manually. This gave me a stronger foundation in Machine Learning fundamentals and improved my understanding of how predictive models actually work.
The project also strengthened my skills in Python, NumPy, Data Science, and mathematical optimization. As I continue learning more advanced Machine Learning techniques, this experience will serve as a strong foundation for future projects and real-world applications.
Screenshots

Leave a Reply
You must be logged in to post a comment.