

Introduction
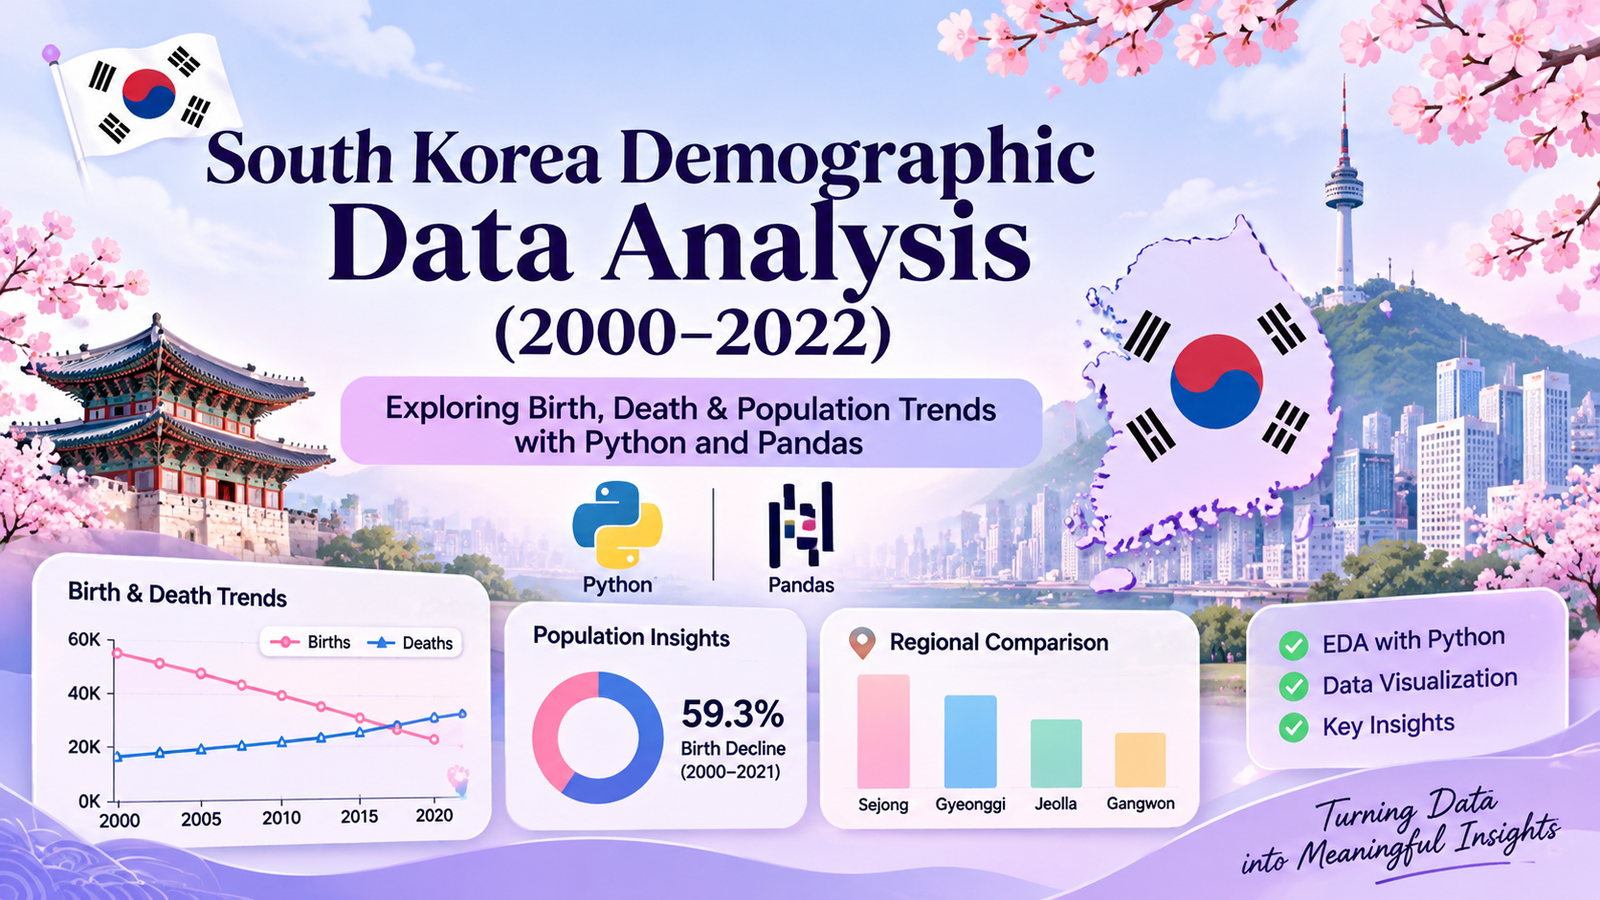
This Python and Pandas EDA project explores South Korea’s demographic trends from 2000 to 2022, using data analysis and visualization to understand birth rates, death rates, and population growth.
Exploratory Data Analysis (EDA) helps us understand complex datasets, identify hidden patterns and discover meaningful insights.
In this project, Python and Pandas are used to perform a detailed demographic analysis of South Korea from January 2000 to June 2022.
South Korea has experienced significant demographic changes over the past two decades. Changes in birth numbers, death numbers and natural population growth provide important indicators of these patterns.
The main objective of this project is to explore these changes using statistical analysis and data visualization. By applying Python libraries such as Pandas, NumPy, Matplotlib and Seaborn, the project examines demographic trends over time and compares differences across regions.
Project Overview
The project, titled South Korea Demographic Data Analysis (2000–2022), focuses on understanding demographic patterns through Exploratory Data Analysis.
The analysis covers:
- Birth and death trends over time.
- Natural population growth.
- Regional birth rate differences.
- Distribution of birth rates.
- Correlations between demographic indicators.
- Missing values and dataset quality.
Dataset Details
| Attribute | Description |
|---|---|
| Country | South Korea |
| Time Period | January 2000 – June 2022 |
| Total Records | 4,860 |
| Total Columns | 12 |
| Data Frequency | Monthly |
| Geographic Coverage | Regions and national aggregate |
| Source | Kaggle |
Tools and Technologies
Python and Pandas EDA involves using powerful libraries to analyze data, clean datasets, and create meaningful visualizations.
Python: The primary programming language used for performing the analysis.
Pandas: Used for data loading, cleaning, grouping and manipulation.
NumPy: Used for numerical operations and calculations.
Matplotlib: Used to create charts and visual representations.
Seaborn: Used for statistical visualizations, including correlation heatmaps and distribution plots.
Jupyter Notebook: Used as the interactive environment for executing Python code and documenting the analysis.
Understanding and Preparing the Dataset
Before performing Exploratory Data Analysis, it is important to understand the structure and characteristics of the dataset.
The dataset was loaded into a Pandas DataFrame using the read_csv() function. The date column was converted into datetime format to support time-based analysis.
Initial data exploration was performed to examine:
- Number of rows and columns.
- Column names and data types.
- Dataset date range.
- Memory usage.
- Sample records.
This initial examination helped establish the structure and characteristics of the demographic data before proceeding with further analysis.
Data Quality Analysis
Data quality is an important part of any data analysis project. Incomplete or duplicated records can affect statistical results and interpretations.
Python and Pandas EDA helps identify missing values and duplicate records.
5.1 Duplicate Data Analysis
Duplicate records were examined using Pandas duplicate-checking methods.
The analysis identified zero duplicate records. This indicates that no duplicate rows were found in the dataset.
5.2 Missing Value Analysis
Missing values were examined by column and region.
The analysis identified:
- 1,475 missing cells.
- 151 records containing missing values.
- Missing values concentrated in the Sejong region.
- 144 Sejong records with all ten demographic measurements missing.
- Seven additional records with only the five rate-based measurements missing.
The missing values were retained without imputation. This decision helped avoid introducing artificial demographic measurements into the analysis.
This step also highlighted an important limitation: regional comparisons involving Sejong should be interpreted carefully because its historical data is incomplete.
Exploratory Data Analysis and Visualizations
Data visualization makes it easier to identify trends, compare regions and understand relationships between demographic indicators.
In this project, six visualizations were created using Matplotlib and Seaborn to explore different aspects of South Korea’s demographic data from 2000 to 2022.
These visualizations help identify changes in birth and death numbers, natural population growth, regional differences and correlations between demographic indicators.
Python and Pandas EDA reveals important demographic trends through visualizations.
6.1 Monthly Birth and Death Trends
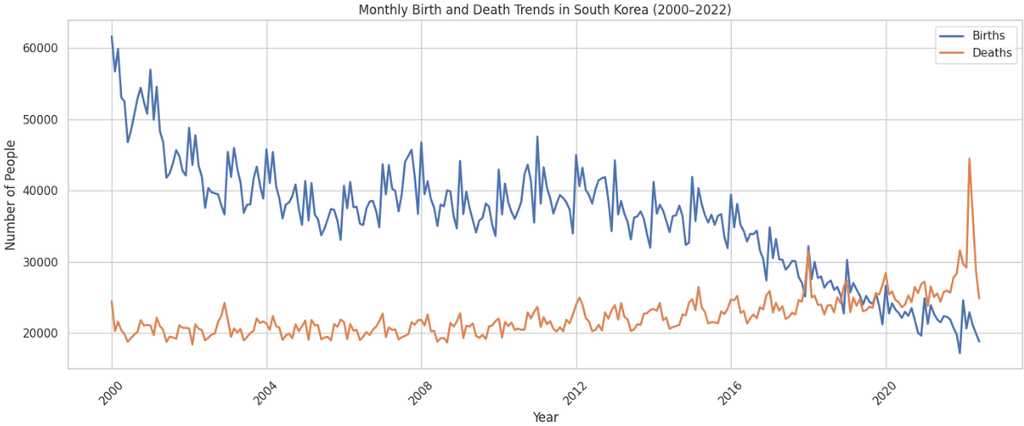
This visualization compares monthly births and deaths in South Korea between 2000 and 2022.
The chart reveals two important patterns:
- Birth numbers show a clear declining trend over the study period.
- Death numbers generally increase over time.
According to the notebook’s annual averages, monthly births decreased from approximately 53,341 in 2000 to 21,714 in 2021. This represents a decline of approximately 59.3%.
During the same period, average monthly deaths increased from approximately 20,728 to 26,481, an increase of approximately 27.8%.
These patterns highlight a major change in the country’s demographic structure.
6.2 Natural Population Growth Trend
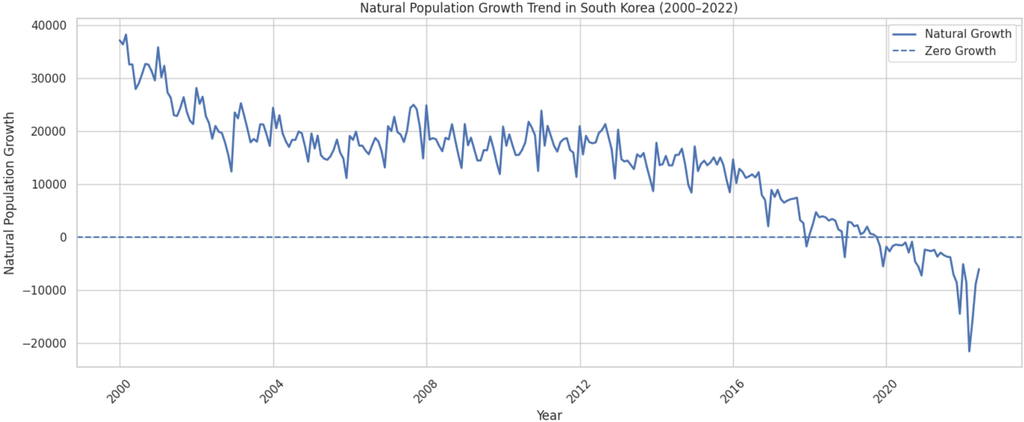
Natural population growth represents the difference between births and deaths.
A positive value indicates that births exceed deaths, while a negative value indicates that deaths exceed births.
The visualization shows a significant decline in natural population growth over the study period.
South Korea recorded its first negative annual average natural population growth in 2020. This means that deaths exceeded births on average during that year.
The declining trend highlights the importance of examining birth and death patterns together rather than independently.
6.3 Regional Distribution of Natural Population Growth Rate
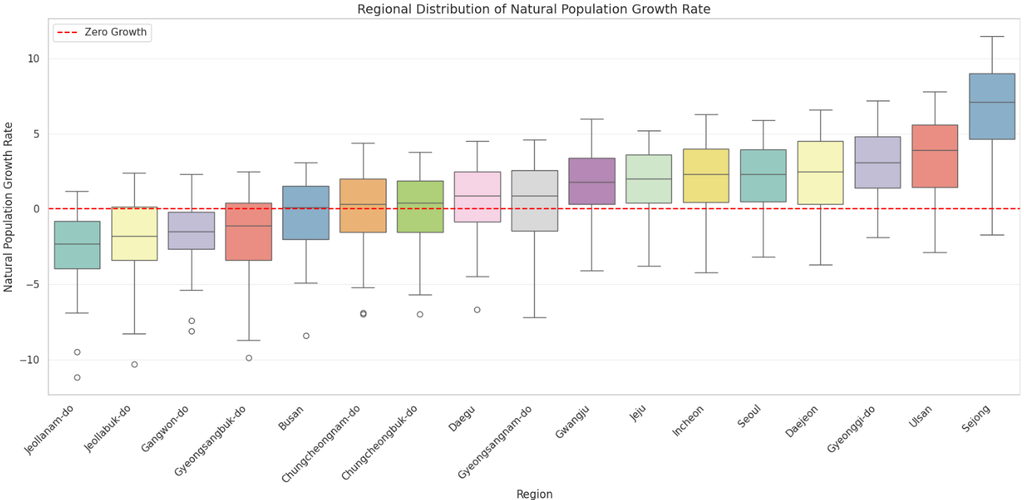
A box plot was used to compare natural population growth rates across different regions from August 2012 to June 2022.
The visualization highlights regional differences:
- Sejong has the highest median natural population growth rate, approximately 7.10.
- Jeollanam-do has the lowest median, approximately -2.30.
- Jeollabuk-do follows with a median of approximately -1.80.
- Gyeonggi-do has a median of approximately 3.10.
The box plot also displays differences in the spread of observations and potential outliers.
This comparison demonstrates that natural population growth is not uniform across all regions.
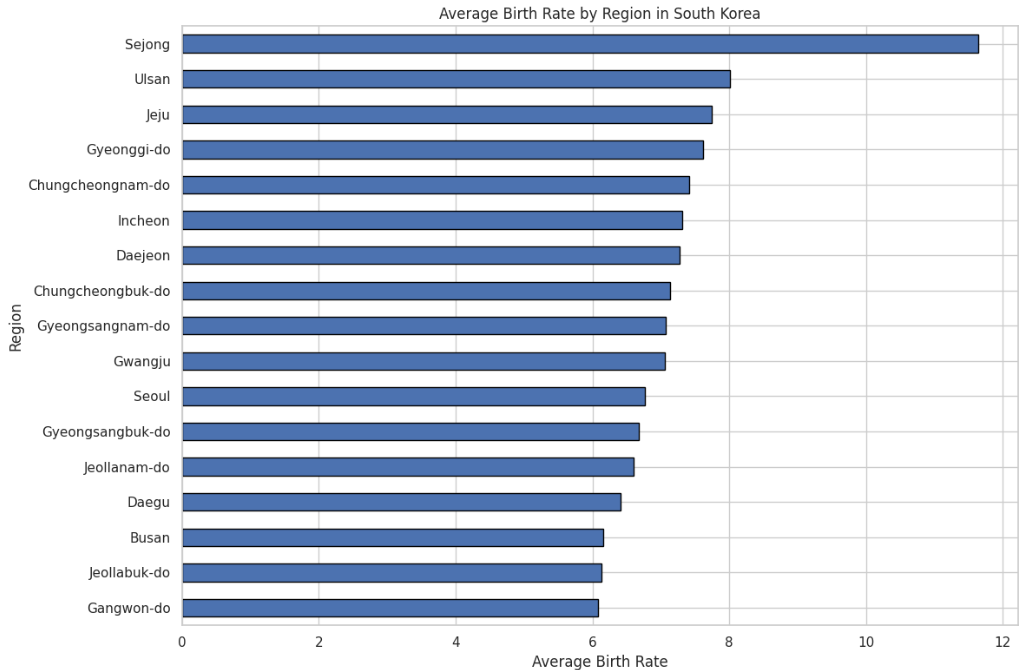
6.4 Average Birth Rate by Region
A regional comparison was performed to identify differences in average birth rates.
The analysis shows that:
- Sejong recorded the highest average birth rate of 11.64.
- Gangwon-do recorded the lowest average birth rate of 6.08.
These results are based on the selected comparison period from August 2012 to June 2022.
The differences indicate that demographic patterns can vary considerably between regions.
6.5 Distribution of Birth Rates
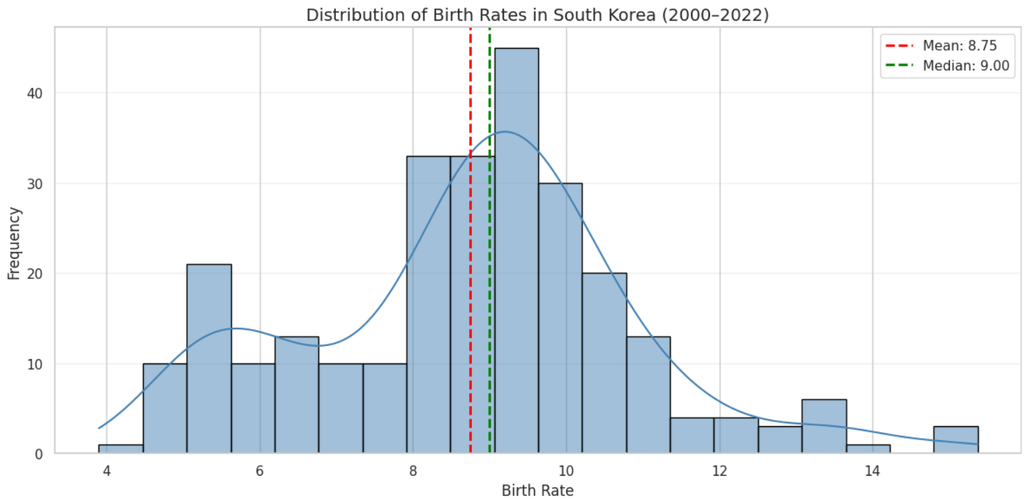
A histogram with a density curve was created to understand how birth rate values are distributed.
The analysis identified the following statistical values:
- Mean: 8.75
- Median: 9.00
- Standard deviation: 2.14
- Minimum: 3.90
- Maximum: 15.37
- Skewness: Approximately 0.11
Most birth rate observations are concentrated between approximately 7 and 10.
The mean and median are close to each other, and the skewness value indicates a nearly symmetrical distribution with a slight positive skew.
6.6 Correlation Between Demographic Indicators
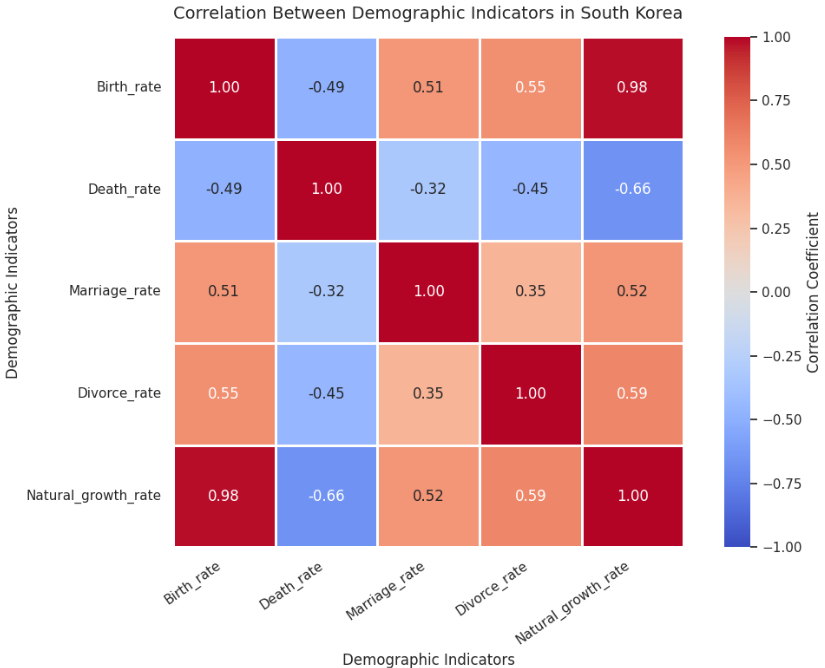
A correlation heatmap was used to examine relationships between birth rate, death rate, marriage rate, divorce rate and natural growth rate.
Important observations include:
| Indicator Relationship | Correlation |
|---|---|
| Birth Rate – Natural Growth Rate | 0.98 |
| Death Rate – Natural Growth Rate | -0.66 |
| Birth Rate – Death Rate | -0.49 |
| Birth Rate – Marriage Rate | 0.51 |
| Divorce Rate – Natural Growth Rate | 0.59 |
The strongest positive relationship appears between birth rate and natural growth rate, with a correlation of approximately 0.98.
Death rate and natural growth rate show a negative correlation of approximately -0.66.
Correlation describes statistical association and does not establish a cause-and-effect relationship.
Key Findings
The overall analysis produced several important findings.
1. Declining Birth Numbers
Average monthly births decreased by approximately 59.3% between 2000 and 2021.
2. Increasing Death Numbers
Average monthly deaths increased by approximately 27.8% over the same period.
3. Negative Natural Population Growth
South Korea recorded negative annual average natural population growth from 2020.
4. Regional Differences
Sejong had the highest average birth rate, while Gangwon-do had the lowest during the selected comparison period.
5. Strong Statistical Relationship
Birth rate and natural growth rate showed a strong positive correlation of approximately 0.978.
These findings demonstrate significant demographic changes and regional differences in South Korea.
Challenges and Data Limitations
One important challenge identified during this project was incomplete historical data for Sejong.
Since missing values were retained without imputation, regional comparisons needed to account for the available observation period.
To make the regional comparisons more meaningful, a common comparison period from August 2012 to June 2022 was used for the regional birth rate and natural growth rate analyses.
This approach helped maintain consistency when comparing regions with different data availability.
The findings should therefore be interpreted with consideration of the dataset’s limitations.
Conclusion
This project demonstrates how Exploratory Data Analysis using Python can help uncover meaningful patterns in real-world demographic datasets.
By combining data cleaning, descriptive statistics, regional comparisons and visualization, the analysis identified declining birth numbers, increasing death numbers and negative natural population growth in South Korea.
The project also highlighted significant regional differences and statistical relationships between demographic indicators.
Overall, Python, Pandas, NumPy, Matplotlib and Seaborn provided an effective foundation for exploring demographic data and communicating analytical findings.
This Python and Pandas EDA project demonstrates the importance of data-driven analysis.
Project Repository
The complete project notebook, Python implementation and analysis are available on GitHub.
Explore the project: https://github.com/PRAJITHAMARY/Korean-Demographics-EDA
Project developed as part of the Data Science Internship at Valentius Kryptix.

Leave a Reply
You must be logged in to post a comment.