
Data Visualization
-
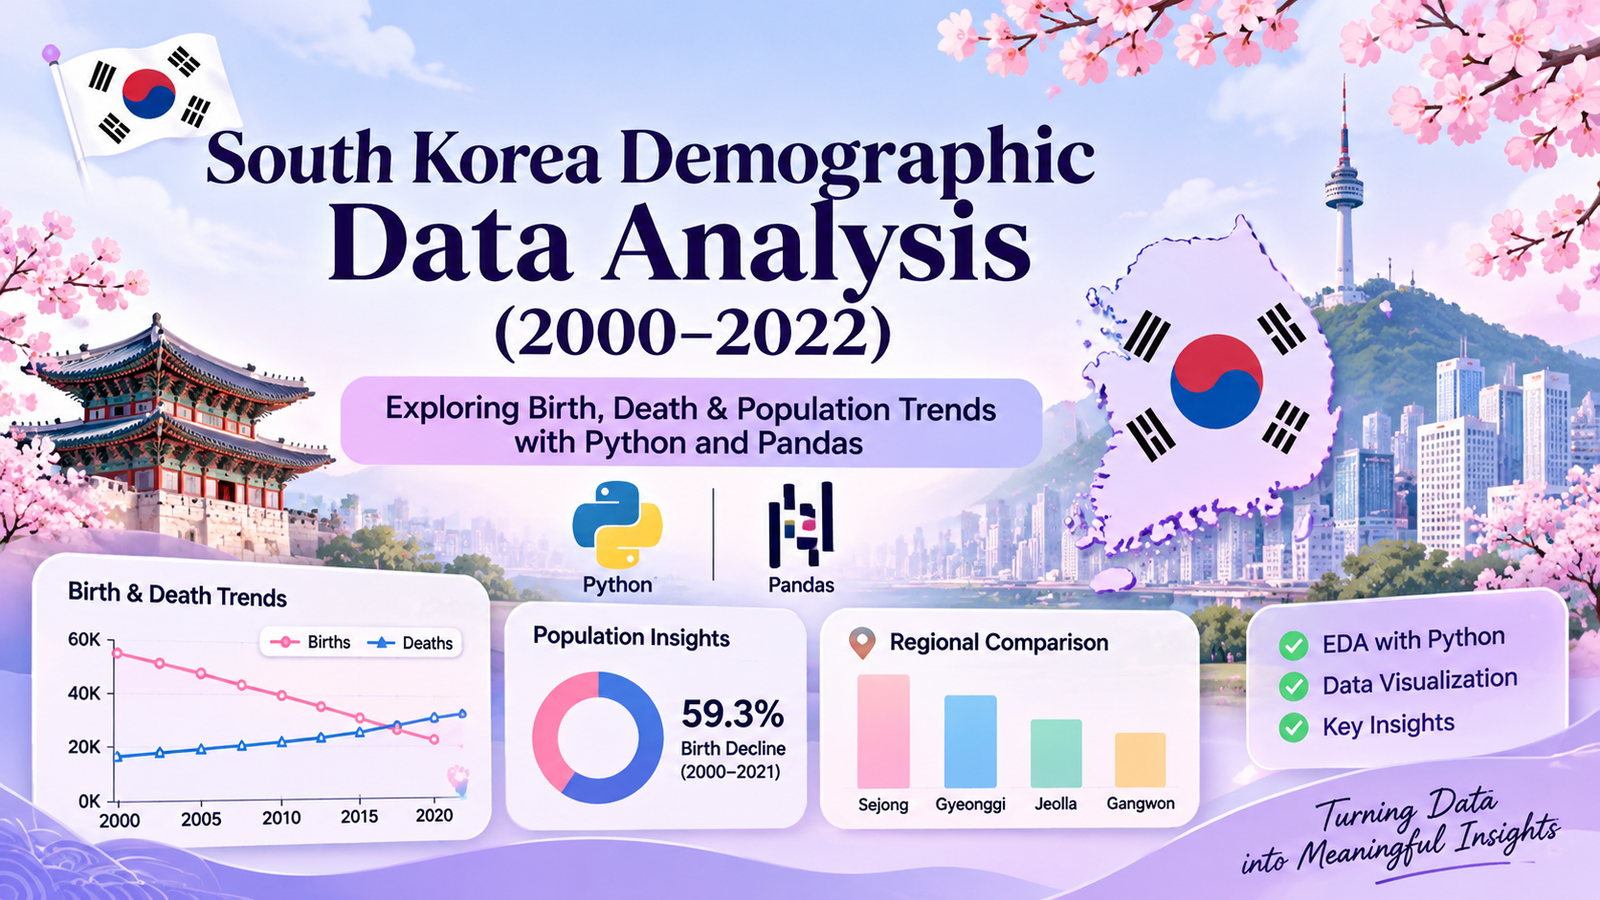
How to perform EDA using Python & Pandas
.
Explore South Korea’s demographic trends from 2000 to 2022 using Python and Pandas. Discover birth, death, population growth and regional insights through data analysis and visualizations.
-
Python & Pandas EDA: A Complete Beginner’s Guide
.
Data is one of the most valuable assets in today’s digital world, but raw data often contains missing values, duplicates, and inconsistencies that make it difficult to analyze. Before…