Data is one of the most valuable assets in today’s digital world, but raw data often contains missing values, duplicates, and inconsistencies that make it difficult to analyze. Before building machine learning models or creating dashboards, data professionals perform Exploratory Data Analysis (EDA) to understand and prepare the dataset.
Python, along with the Pandas library, has become the industry standard for performing EDA because of its simplicity, flexibility, and powerful data manipulation capabilities. Whether you’re a beginner or an experienced data analyst, mastering Python & Pandas EDA will help you uncover meaningful insights and improve the quality of your data-driven decisions.
In this guide, you’ll learn what Exploratory Data Analysis is, why Python and Pandas are the best tools for the job, and how to perform essential EDA tasks with practical code examples.
What is Exploratory Data Analysis (EDA)?
Exploratory Data Analysis (EDA) is the process of examining a dataset to understand its structure, identify patterns, detect anomalies, and prepare it for further analysis or machine learning.
The primary objectives of EDA include:
- Understanding the structure of the dataset
- Identifying missing values
- Detecting duplicate records
- Finding outliers
- Exploring relationships between variables
- Summarizing important statistics
- Preparing clean data for modeling
Performing EDA helps improve data quality and enables better business and analytical decisions.
Why Use Python for EDA?
Python is one of the most popular programming languages for data analysis because it is easy to learn and offers a vast ecosystem of libraries.
Some benefits of using Python include:
- Simple and readable syntax
- Strong community support
- Extensive data analysis libraries
- Excellent visualization tools
- Easy integration with machine learning frameworks
- Ability to handle large datasets efficiently
Python allows analysts to automate repetitive tasks and perform complex analyses with just a few lines of code.
Why Pandas is the Preferred Library
Pandas is an open-source Python library designed specifically for data manipulation and analysis.
It introduces two powerful data structures:
- Series
- DataFrame
A DataFrame works like a spreadsheet but provides much greater flexibility and computational power.
With Pandas, you can:
- Read CSV, Excel, SQL, and JSON files
- Clean and transform datasets
- Filter and sort data
- Handle missing values
- Merge multiple datasets
- Perform statistical analysis
- Aggregate and summarize information
These features make Pandas one of the most important libraries in data science.
Installing the Required Libraries
Install the required libraries using pip:
pip install pandas matplotlib seaborn
Import the libraries:
import pandas as pd
import matplotlib.pyplot as plt
import seaborn as sns
Loading a Dataset
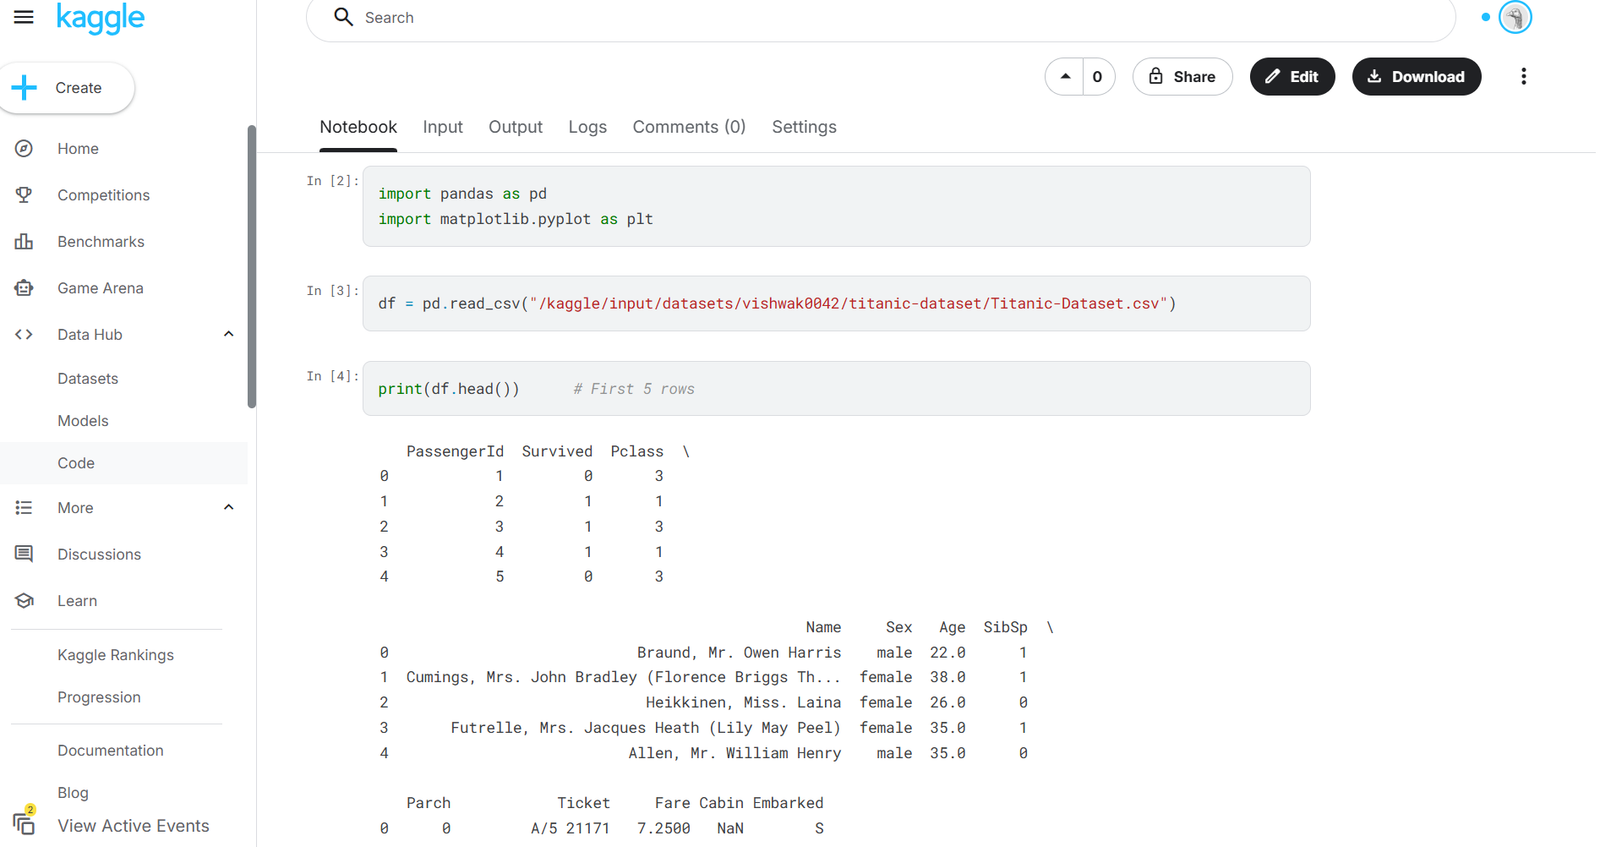
The first step in EDA is loading the dataset.
df = pd.read_csv("sales.csv")
Display the first five rows:
df.head()
This helps verify that the dataset has been imported correctly.
Understanding the Dataset
Before cleaning or analyzing data, it is important to understand its structure.
Dataset Information
df.info()
This displays:
- Number of rows
- Number of columns
- Data types
- Missing values
- Memory usage
Summary Statistics
df.describe()
The output includes:
- Mean
- Median
- Standard deviation
- Minimum value
- Maximum value
- Quartiles
These statistics provide a quick overview of numerical columns.
Handling Missing Values
Real-world datasets often contain missing information.
Check for missing values:
df.isnull().sum()
Fill missing numerical values:
df.fillna(df.mean(numeric_only=True), inplace=True)
Remove rows with missing values:
df.dropna(inplace=True)
Cleaning missing data improves the accuracy of future analysis.
Removing Duplicate Records
Duplicate records can lead to incorrect analysis.
Check duplicates:
df.duplicated().sum()
Remove duplicates:
df.drop_duplicates(inplace=True)
This ensures every record in the dataset is unique.
Filtering Data
Filtering allows analysts to focus on specific records.
Example:
df[df["Sales"] > 1000]
This returns all records where sales are greater than 1000.
Grouping Data
Grouping helps summarize information based on categories.
Example:
df.groupby("Category")["Sales"].mean()
This calculates the average sales for each category.
Grouping is useful for business reporting and performance analysis.
Data Visualization
Visualizations help identify trends and patterns that are difficult to spot in raw tables.
Histogram
df["Sales"].hist()
plt.show()
A histogram shows how sales values are distributed.
(Insert Histogram Screenshot Here)
Box Plot
sns.boxplot(data=df["Sales"])
plt.show()
Box plots help identify outliers.
(Insert Box Plot Screenshot Here)
Correlation Heatmap
sns.heatmap(df.corr(numeric_only=True), annot=True, cmap="Blues")
plt.show()
Heatmaps display relationships between numerical variables.
Strong correlations can indicate meaningful patterns within the dataset.
(Insert Heatmap Screenshot Here)
Typical Python & Pandas EDA Workflow
A structured EDA process usually follows these steps:
- Import the required libraries.
- Load the dataset.
- Inspect the data.
- Check data types.
- Handle missing values.
- Remove duplicate records.
- Analyze summary statistics.
- Visualize data distributions.
- Detect outliers.
- Study feature correlations.
- Generate meaningful insights.
Following this workflow ensures a systematic and reliable analysis process.
Best Practices for Exploratory Data Analysis
To perform effective EDA, follow these best practices:
- Always inspect the dataset before making changes.
- Verify data types.
- Handle missing values carefully.
- Remove duplicate records.
- Validate outliers before deleting them.
- Use multiple visualization techniques.
- Document every cleaning step.
- Save a copy of the cleaned dataset.
These practices improve reproducibility and ensure high-quality analysis.
Real-World Applications of Python & Pandas EDA
Exploratory Data Analysis is used in various industries, including:
- Business Intelligence
- Finance
- Healthcare
- Retail
- Marketing
- Manufacturing
- Education
- Data Science
- Machine Learning
Organizations use EDA to identify trends, detect anomalies, improve decision-making, and prepare data for predictive analytics.
Conclusion
Python & Pandas EDA is an essential skill for anyone working with data. Before building predictive models or creating dashboards, it is crucial to understand and clean the dataset through exploratory analysis.
By using Pandas, analysts can efficiently manipulate data, while visualization libraries such as Matplotlib and Seaborn make it easier to identify trends, correlations, and outliers. A structured EDA workflow improves data quality, enhances analytical accuracy, and lays the foundation for successful machine learning projects.
Whether you’re just starting your journey in data analytics or looking to strengthen your skills, mastering Python & Pandas EDA will help you confidently work with real-world datasets and extract meaningful insights from data.
Frequently Asked Questions (FAQs)
What is EDA in Python?
EDA (Exploratory Data Analysis) is the process of analyzing and understanding a dataset using statistical summaries and visualizations before applying machine learning or advanced analytics.
Why is Pandas used for EDA?
Pandas provides powerful tools for data cleaning, filtering, grouping, transformation, and statistical analysis, making it one of the most widely used libraries for exploratory data analysis.
Which libraries are commonly used with Pandas?
The most commonly used libraries are:
- NumPy
- Matplotlib
- Seaborn
- Scikit-learn
Is Python & Pandas EDA suitable for beginners?
Yes. Python’s simple syntax and Pandas’ easy-to-use functions make exploratory data analysis accessible for beginners while still being powerful enough for professionals.
Focus Keyword: Python & Pandas EDA
Suggested URL Slug: python-pandas-eda

Leave a Reply