

Introduction
Supervised Learning is one of the most widely used approaches in machine learning for solving classification and prediction problems. In this project, I explored supervised learning by comparing five machine learning classification algorithms on the Titanic dataset.
“Could this passenger have survived the Titanic disaster?”
This is a classic example of a supervised learning classification problem. The model receives historical data where the correct answer is already known, learns patterns from that data, and then uses those patterns to make predictions for new observations.
As part of my internship at Valentius Kryptix, I worked on a practical machine learning project to understand how different supervised learning algorithms behave when they are trained and evaluated on the same real-world dataset.
Instead of training just one model, I performed a comparative study of five popular classification algorithms:
- Logistic Regression
- Decision Tree
- K-Nearest Neighbors (KNN)
- Support Vector Machine (SVM)
- Naive Bayes
The objective was not simply to find a model with the highest accuracy. I wanted to understand which algorithm performed best, why it performed well, where other models struggled, and why model evaluation should consider multiple metrics.
What Is Supervised Learning?
Supervised learning is a branch of machine learning in which an algorithm learns from a dataset containing both input features and known target labels.
For example, suppose we want to predict whether a passenger survived the Titanic disaster.
The input features might include:
- Age
- Gender
- Passenger class
- Fare
- Number of siblings or spouses
- Number of parents or children
- Port of embarkation
The target variable is:
Survived
where:
0= Did not survive1= Survived
During training, the machine learning algorithm studies the relationship between these input features and the known target values. After learning, the model can make predictions on passengers it has never seen before.
Supervised learning is commonly divided into two major categories:
Classification
Classification predicts a discrete category.
Examples include:
- Spam or not spam
- Fraud or legitimate
- Disease or no disease
- Survived or did not survive
Regression
Regression predicts a continuous numerical value.
Examples include:
- House price prediction
- Temperature prediction
- Sales forecasting
Since the Titanic project predicts one of two classes, it is a binary classification problem.
Why Compare Multiple Machine Learning Algorithms?
One of the most important lessons in machine learning is that there is no universally best algorithm.
Different algorithms make different assumptions about data and learn patterns in different ways.
A model that performs extremely well on one dataset may perform poorly on another.
Therefore, instead of selecting an algorithm based only on popularity, it is useful to train multiple models using the same data and evaluation process.
For this project, I wanted to answer four questions:
- Which classification algorithm performs best?
- Which model performs worst?
- How do the models differ across accuracy, precision, recall, and F1-score?
- What can the results tell us about the dataset and the algorithms?
Dataset: The Titanic Classification Problem
For this experiment, I used the Titanic dataset, a well-known real-world dataset frequently used for learning and demonstrating machine learning classification.
The dataset contains 891 passenger records.
Each passenger is represented using several attributes, including:
| Feature | Description |
|---|---|
| Pclass | Passenger class |
| Sex | Passenger gender |
| Age | Passenger age |
| SibSp | Number of siblings/spouses |
| Parch | Number of parents/children |
| Fare | Ticket fare |
| Embarked | Port of embarkation |
The target variable is Survived.
The objective is straightforward:
Use passenger information to predict whether the passenger survived the Titanic disaster.
However, the dataset is not perfectly clean, which makes it more realistic for a machine learning workflow.
Data Cleaning and Preprocessing
Before training any model, the data needs to be prepared properly.
This step is often underestimated, but good preprocessing can have a major impact on machine learning performance.
Removing Unnecessary Features
Some columns were removed because they were not used as predictive features in this experiment:
- PassengerId
- Name
- Ticket
- Cabin
The remaining features were used for model training.
Handling Missing Values
The dataset contains missing values, particularly in the Age and Embarked columns.
Instead of simply deleting incomplete rows, missing values were handled through an automated preprocessing pipeline.
For numerical features, median imputation was used.
For categorical features, the most frequent value was used for imputation.
Encoding Categorical Features
Machine learning algorithms generally require numerical input.
Therefore, categorical variables such as:
- Sex
- Embarked
were transformed using One-Hot Encoding.
Feature Scaling
Feature scaling is particularly important for distance- and margin-based algorithms such as KNN and SVM.
The numerical features were standardized using StandardScaler.
An important part of this project was maintaining a consistent preprocessing pipeline across all models, making the comparison more meaningful and fair.
Supervised Learning Algorithms: 5 Models Compared
Now let’s look at the five algorithms used in this experiment.
1. Logistic Regression
Despite its name, Logistic Regression is a classification algorithm.
It estimates the probability that an observation belongs to a particular class.
For binary classification, the model predicts probabilities between 0 and 1 and then assigns the observation to a class based on a decision threshold.
Logistic Regression is popular because it is:
- Simple
- Fast
- Interpretable
- Effective as a baseline classification model
It was therefore an important starting point for this comparison.
2. Decision Tree
A Decision Tree works by repeatedly splitting the data according to feature values.
It can be visualized like a flowchart.
For example, the model might learn patterns involving:
Sex → Passenger Class → Age → Prediction
One advantage of Decision Trees is that they can capture nonlinear relationships and are relatively easy to interpret.
However, trees can also become too complex and overfit the training data.
For this project, a maximum depth was used to control the complexity of the tree.
3. K-Nearest Neighbors (KNN)
K-Nearest Neighbors, commonly known as KNN, takes a different approach.
Instead of learning a traditional mathematical decision boundary, KNN looks at the observations that are closest to a new data point.
The basic idea is:
Similar observations are likely to belong to similar classes.
For example, if a new passenger is surrounded by several passengers who survived, KNN may predict that the new passenger also belongs to the survival class.
Because KNN relies heavily on distance calculations, feature scaling is extremely important.
In this experiment, KNN achieved the highest F1-score among all five models.
4. Support Vector Machine (SVM)
Support Vector Machine, or SVM, attempts to find an effective boundary that separates different classes.
The SVM model used in this project employed an RBF kernel, allowing it to model more complex relationships than a simple linear boundary.
SVM is particularly useful when the classes are not easily separated using a simple linear relationship.
In this experiment, SVM achieved the highest precision among the five models.
5. Naive Bayes
Naive Bayes is a probabilistic classification algorithm based on Bayes’ theorem.
It makes a simplifying assumption that the features are conditionally independent given the class.
Although this assumption may not perfectly represent real-world data, Naive Bayes can still perform surprisingly well on many classification problems.
It is also computationally efficient and provides a useful comparison against the other algorithms.
How Does Supervised Learning Model Evaluation Work?
Accuracy alone does not always tell the complete story.
For this reason, four evaluation metrics were used.
Accuracy
Accuracy measures the percentage of total predictions that were correct.
Accuracy = Correct Predictions / Total Predictions
Precision
Precision answers:
Of all the passengers predicted as survivors, how many actually survived?
A higher precision means fewer false-positive predictions.
Recall
Recall answers:
Of all the passengers who actually survived, how many did the model correctly identify?
A higher recall means fewer survivors were missed.
F1-Score
F1-score combines precision and recall into a single metric.
This makes it particularly useful when we want a balance between the two.
For this project, F1-score was used as the primary metric for ranking the models.
Model Comparison: Which Algorithm Won?
After training all five models using the same train-test split and preprocessing strategy, the following results were obtained:
| Rank | Model | Accuracy | Precision | Recall | F1-Score |
|---|---|---|---|---|---|
| 🥇 1 | KNN | 81.56% | 80.00% | 69.57% | 74.42% |
| 🥈 2 | SVM | 81.56% | 82.14% | 66.67% | 73.60% |
| 🥉 3 | Logistic Regression | 80.45% | 79.31% | 66.67% | 72.44% |
| 4 | Naive Bayes | 78.77% | 73.85% | 69.57% | 71.64% |
| 5 | Decision Tree | 76.54% | 75.47% | 57.97% | 65.57% |
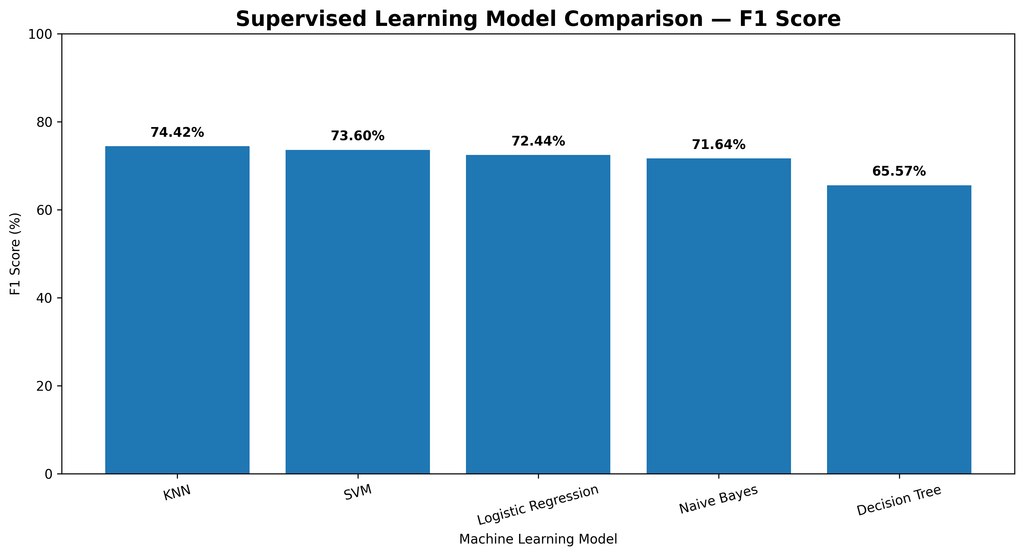
The results show that KNN achieved the best overall F1-score of 74.42%.
Interestingly, KNN and SVM achieved exactly the same accuracy of 81.56%, but KNN achieved a slightly higher F1-score.
SVM, on the other hand, achieved the highest precision of 82.14%.
This is a good example of why looking at only one metric can be misleading.
📊 Visual Comparison of Model Performance
Recommended image Alt Text:
F1-score comparison of five supervised learning classification algorithms on the Titanic dataset
The visualization makes the difference between the five models easier to understand.
KNN appears at the top based on F1-score, while Decision Tree produces the lowest F1-score in this experiment.
🏆 Why Did KNN Perform Best?
KNN achieved an F1-score of 74.42%, making it the best-performing model in this experiment.
One possible reason is that the preprocessing pipeline produced standardized numerical features and encoded categorical variables, which allowed KNN to calculate distances more consistently.
The Titanic dataset contains patterns related to features such as gender, passenger class, age, and fare.
KNN can capture local similarities among observations, which may have helped it identify useful patterns in this dataset.
However, this does not mean KNN is always the best algorithm.
Its performance can depend heavily on:
- Feature scaling
- Choice of
k - Feature representation
- Dataset size
- Distribution of observations
Therefore, the result should be interpreted as:
KNN performed best for this particular experimental setup and dataset.
📉 Why Did Decision Tree Perform Worst?
The Decision Tree achieved an F1-score of 65.57%, the lowest among the five models.
Its lower performance may be related to how the selected tree structure generalized to unseen data.
Decision Trees divide the feature space through a series of rules. If those rules do not generalize well, predictions on new observations can become less accurate.
Although controlling the tree depth helps reduce unnecessary complexity, the selected configuration still did not outperform the other algorithms in this experiment.
This highlights an important machine learning lesson:
A more flexible or interpretable algorithm is not automatically the best-performing algorithm for every dataset.
🔍 What Did This Experiment Teach Me?
This project provided several practical lessons about machine learning.
1. Preprocessing Matters
Different algorithms have different requirements.
For example, KNN depends heavily on distances, so feature scaling is important.
2. One Metric Is Not Enough
KNN and SVM had the same accuracy, but their precision, recall, and F1-score were different.
Therefore, evaluating several metrics gives a much more complete picture.
3. Model Selection Is Data-Dependent
There is no algorithm that wins on every dataset.
The best model depends on:
- Dataset characteristics
- Feature representation
- Noise
- Class distribution
- Hyperparameters
- Preprocessing choices
4. Fair Comparison Is Important
All five models were evaluated using the same train-test split and consistent preprocessing strategy.
This makes the comparison more meaningful because differences in performance are less likely to come from differences in the data preparation process.
5. Accuracy Can Hide Important Details
An accuracy score may look impressive while recall or precision tells a different story.
For classification problems, it is therefore important to understand what each metric actually measures.
💡 Final Takeaway
The most important lesson from this project is simple:
Machine learning is not just about training a model. It is about understanding the data, choosing appropriate algorithms, preprocessing the features correctly, and evaluating the results carefully.
In this comparative study, five supervised learning algorithms were trained on the Titanic dataset using a consistent machine learning workflow.
KNN achieved the best F1-score at 74.42%, while SVM achieved the highest precision at 82.14%. Decision Tree recorded the lowest F1-score at 65.57%.
The experiment demonstrates that different algorithms can learn different patterns from the same dataset and that model performance should be evaluated using multiple metrics rather than relying on accuracy alone.
This project strengthened my practical understanding of supervised learning, classification algorithms, data preprocessing, feature scaling, model evaluation, and comparative machine learning experimentation.
🚀 Conclusion
Supervised learning provides a powerful foundation for solving real-world classification and prediction problems.
By comparing Logistic Regression, Decision Tree, KNN, SVM, and Naive Bayes, this project demonstrates how algorithm choice can influence model performance.
The next step in a real machine learning workflow would be to explore hyperparameter tuning, cross-validation, feature engineering, ensemble methods, and more advanced model optimization techniques.
The complete project, including the notebook, dataset, preprocessing pipeline, model implementations, and evaluation results, is available on GitHub.
GitHub:https://github.com/student-Madhumitakhatua/ML-Classification-Model-Arena

Leave a Reply
You must be logged in to post a comment.