

Finding Structure Without Labels: K-Means and PCA on Wine Chemistry
An unsupervised learning project on the UCI Wine dataset
What if you could sort wines into meaningful groups without ever being told which grape each one came from? That’s the promise of unsupervised learning, and it’s what I set out to test in this project.
What is unsupervised learning?
Most machine learning examples are supervised: you give the model inputs along with the correct answers, and it learns to predict them. Unsupervised learning removes the answers. The algorithm gets only the raw data and has to find patterns by itself, such as groups of similar items, hidden structure, or the directions along which the data varies most.
For my task, I used two classic techniques: K-Means clustering to group the data, and Principal Component Analysis (PCA) to visualize it.
The dataset
I used the UCI Wine dataset, which ships with scikit-learn. It contains 178 wines, each described by 13 chemical measurements such as alcohol, malic acid, flavanoids, color intensity, hue, and proline. The dataset also includes the grape cultivar for each wine, but I hid those labels while fitting the model. I used them only once, at the very end, as a sanity check.
Step 1: Scaling the features
The first step is easy to overlook and matters a lot. Proline values run from hundreds up to 1,600, while hue sits around 1. K-Means relies on distances, so without scaling, proline would drown out everything else. I standardized every feature with StandardScaler so each one contributes fairly.
Step 2: Choosing the number of clusters
K-Means needs you to pick k in advance, so I tried every value from 2 to 10 and used two diagnostics: the elbow method (inertia) and the silhouette score.
Inertia dropped sharply from k=2 to k=3 (1658.8 to 1277.9) and flattened afterward. The silhouette score peaked at k=3 with a value of 0.285. That’s a moderate score, which means the clusters are real but overlap somewhat. The elbow was soft rather than razor-sharp, which is typical of real data. Both signals pointed to k=3.
Step 3: Visualizing with PCA
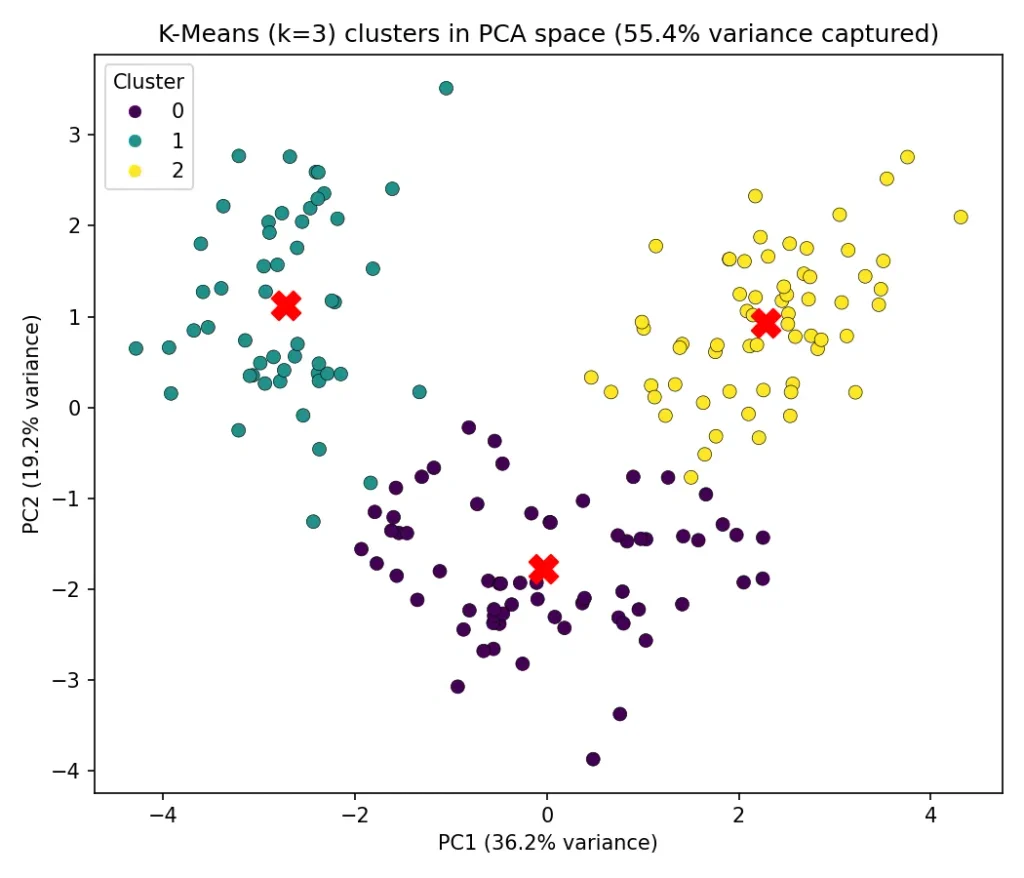
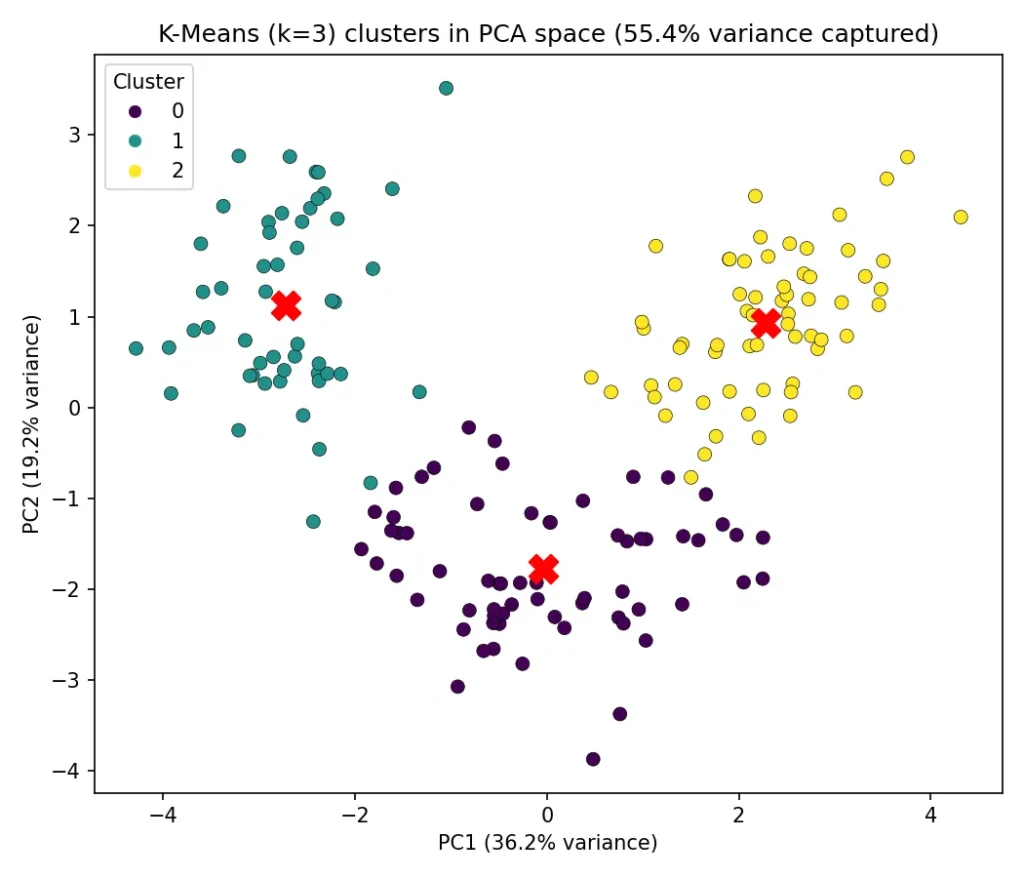
Thirteen dimensions can’t be plotted, so I reduced the scaled data to two principal components. PC1 explains 36.2% of the variance and PC2 explains 19.2%, so the 2D view captures 55.4% of the total. This is worth being honest about: nearly half the information isn’t visible in the plot, so some of the overlap between clusters may just be a side effect of the projection. Even so, the three clusters separate clearly in the PCA plot.
Step 4: What do the clusters mean?
Looking at each cluster’s average chemistry gave them distinct personalities:
- Cluster 2 (62 wines): full-bodied and rich. Highest alcohol (13.68), flavanoids (3.00), and proline (1,100).
- Cluster 0 (65 wines): light and pale. Lowest alcohol (12.25) and by far the lowest color intensity (about 3).
- Cluster 1 (51 wines): dark and sharp. Highest malic acid (3.31) and color intensity (7.23), with the lowest flavanoids (0.82) and hue.
The sanity check
At the end I finally compared my clusters to the hidden cultivar labels. The Adjusted Rand Index came out at 0.897, where 1.0 would be a perfect match. Only 6 of the 178 wines landed in a different cluster than their true grape variety. The model recovered real grape varieties from chemistry alone.
Limitations
This result comes with caveats:
- A silhouette score of 0.285 means cluster boundaries are fuzzy.
- K-Means assumes roughly spherical clusters of similar size.
- The 2D PCA plot keeps only 55% of the variance.
- With only 178 samples, the choice of k is less certain than it would be on a larger dataset.
Takeaways
Three things stood out to me. Preprocessing, scaling in particular, can matter more than the algorithm itself. Evaluation metrics like silhouette and explained variance help you stay honest about how much to trust a result. And unsupervised methods can discover meaningful structure when you let the data speak.
The full code, figures, and run log are on my GitHub: https://github.com/yeshi-rnj/Unsupervised-Learning


Leave a Reply
You must be logged in to post a comment.