

1. Introduction
Data plays an important role in understanding patterns, trends, and making informed decisions. During my internship at Valentius Kryptix, I worked on an End-to-End Exploratory Data Analysis (EDA) project using the Netflix Titles dataset. The objective was to explore the available data, identify meaningful patterns, understand the distribution of movies and TV shows, and communicate findings through visualizations.
This project helped me understand how raw data can be transformed into useful information through data cleaning, analysis, visualization, and interpretation.
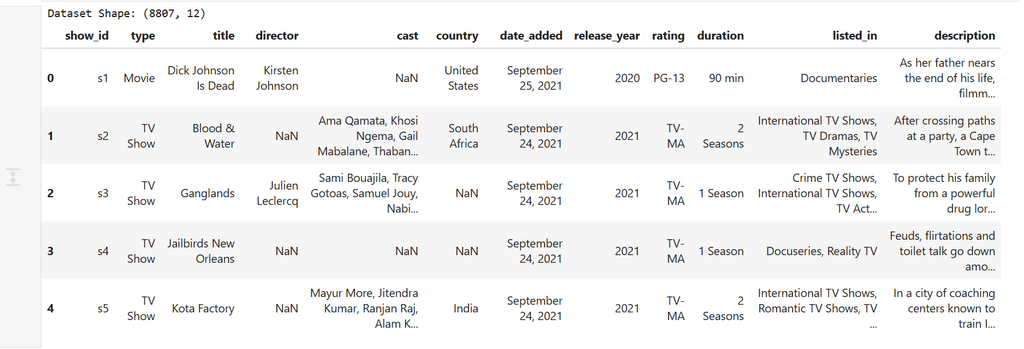
Overview of the Netflix Content Analysis EDA project.
2. Project Overview
The project uses a public Netflix Titles dataset containing information about movies and TV shows available on Netflix. The dataset includes fields such as title, type, director, cast, country, date added, release year, rating, duration, genres, and description.
The original dataset contained 8,807 rows and 12 columns. During the cleaning and preparation process, I added two derived columns to support further analysis, resulting in a dataset with 8,807 rows and 14 columns.
The main objectives were to:
- Understand the structure and quality of the dataset.
- Identify and handle missing values.
- Prepare the data for exploratory analysis.
- Explore content distribution and year-wise trends.
- Create visualizations to communicate findings.
- Document the process and key learnings.
3. Tools and Technologies Used
I used the following tools and libraries throughout the project:
- Python: For data analysis and processing.
- Pandas: For loading, cleaning, transforming, and exploring the dataset.
- Matplotlib: For creating charts and visualizations.
- Seaborn: For statistical and exploratory visualizations.
- Jupyter Notebook: For executing code, documenting steps, and recording findings.
These tools helped me work systematically through the different stages of the EDA process.
4. Data Cleaning and Preprocessing
Data cleaning was an important part of this project because real-world datasets may contain missing values, inconsistent formats, and fields that require transformation.
I inspected the dataset structure, checked data types, identified missing values, and prepared relevant columns for analysis. I also created additional features to support more detailed exploration.
After cleaning, some missing values remained in fields where information was unavailable or where a value did not apply to a particular content type. For example, the duration of a TV show may be represented differently from the duration of a movie. Therefore, missing values need to be handled according to the meaning of each column rather than replaced blindly.
The final dataset retained 8,807 rows and contained 14 columns. This preparation made the data more suitable for further analysis and visualization.
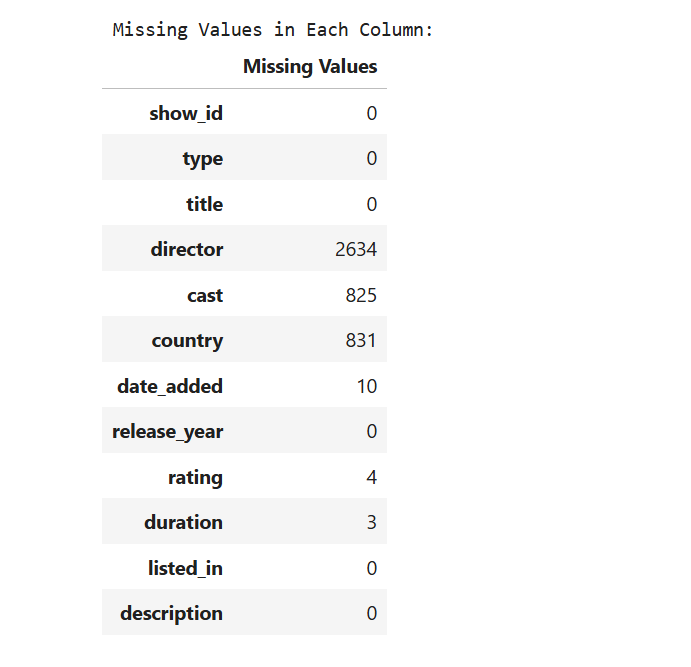
Missing-value inspection and data preprocessing using Pandas.
5. Exploratory Data Analysis and Key Findings
Content Type Distribution
One of the first steps was to examine the distribution of movies and TV shows. This comparison helps explain the overall composition of the Netflix catalog represented in the dataset.
Year-wise Content Addition
I also explored the number of titles added to Netflix over different years. The analysis showed that 2019 had the highest number of titles added, with 1,999 titles. This was followed by 2020, with 1,878 titles, and 2021, with 1,498 titles.
These results highlight how the number of titles added varied over time. They describe the dataset’s recorded additions and should not be interpreted as a complete measure of Netflix’s total production in each year.
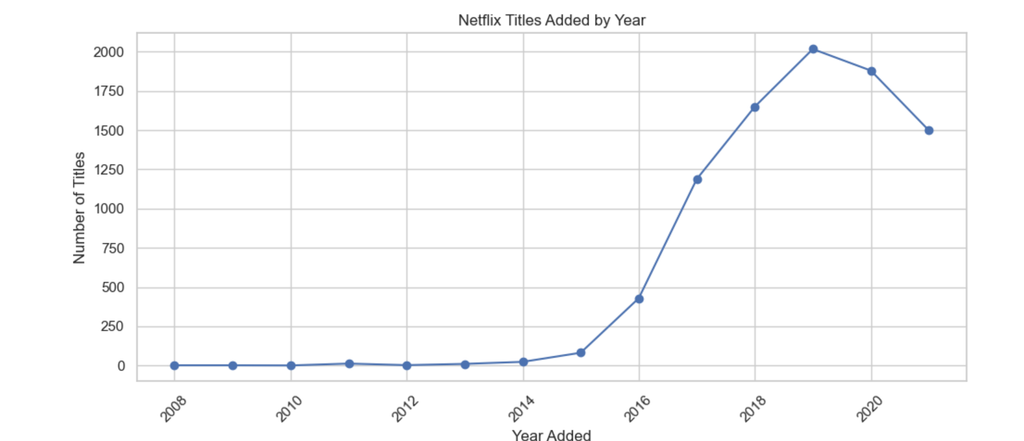
Year-wise analysis showing 2019 as the peak year for titles added in the dataset.
Genre and Country Analysis
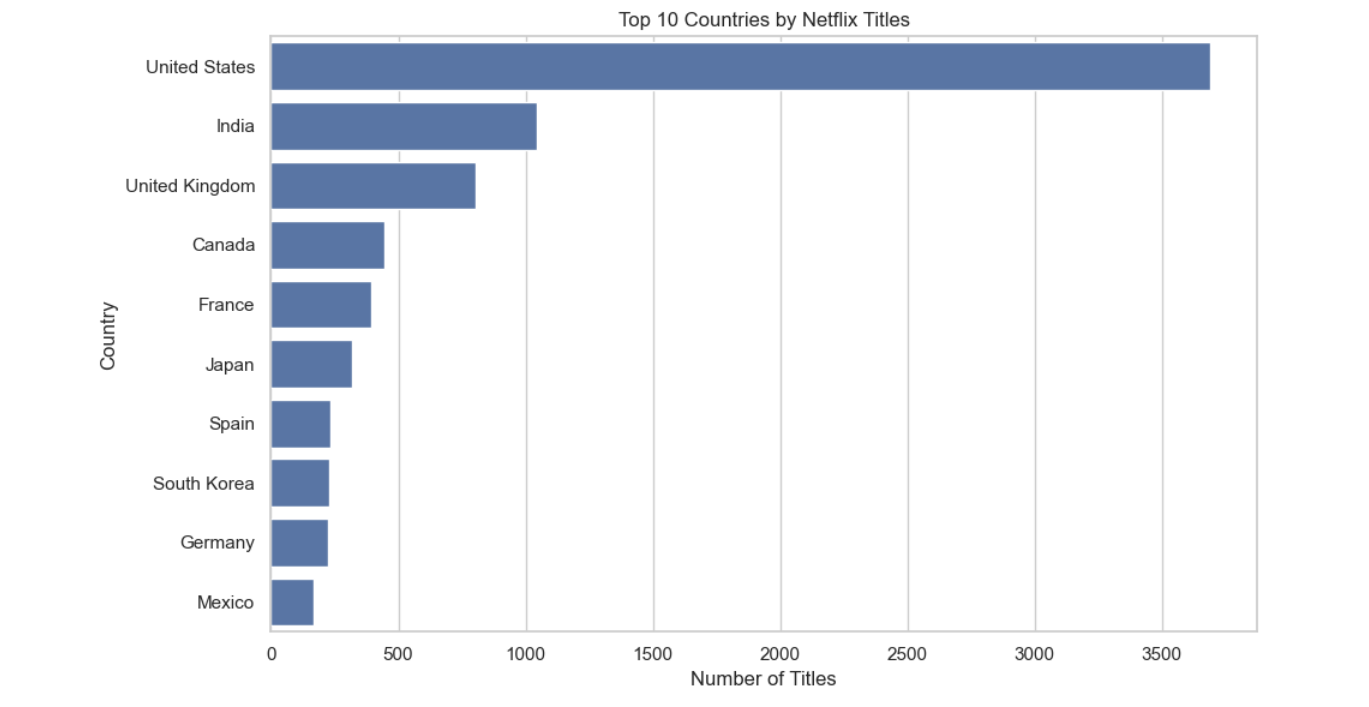
Genre analysis helps identify common categories represented in the dataset. Country-wise analysis can also show how the catalog is distributed across different countries. These comparisons help make a large dataset easier to understand and explore.
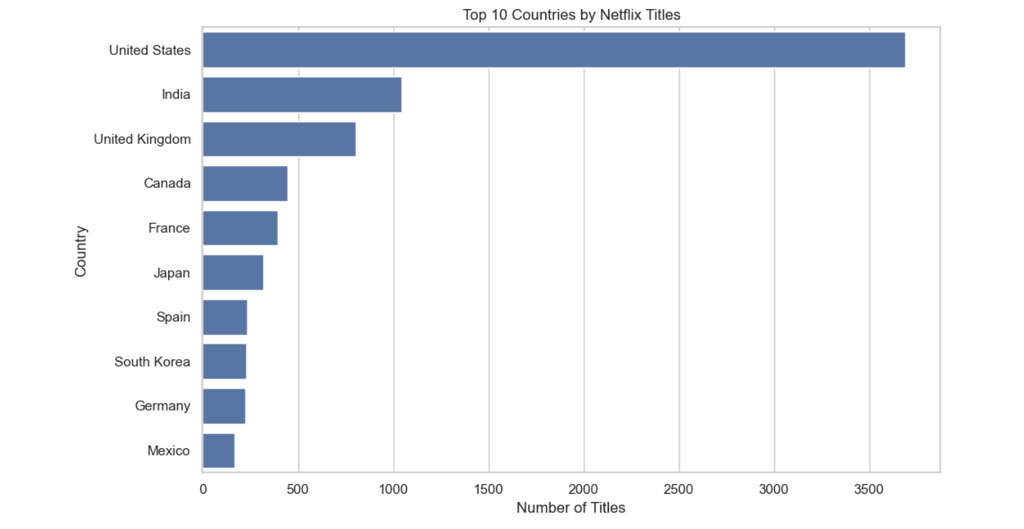
Exploring genre and country patterns in Netflix content.
Ratings and Duration
I examined fields such as content ratings and duration to understand how titles are categorized and how movie lengths are represented. These fields also demonstrate why correct data types and careful preprocessing matter when creating visualizations.
The charts accompanying this article should be taken from the actual project notebook so that every displayed value matches the analysis.
6. Statistical Analysis
Statistical analysis can help investigate whether an observed difference between groups is meaningful or could have occurred by chance. A hypothesis test requires a clearly defined null hypothesis, an alternative hypothesis, an appropriate statistical test, and interpretation of the p-value.
For this project, the statistical analysis should be documented using the test actually performed in the notebook. The final report should state the groups compared, the test statistic, the p-value, the significance level, and the conclusion. A result should only be described as statistically significant when the calculated evidence supports that conclusion.
This step reinforced the importance of supporting observations with appropriate statistical evidence instead of relying only on charts.
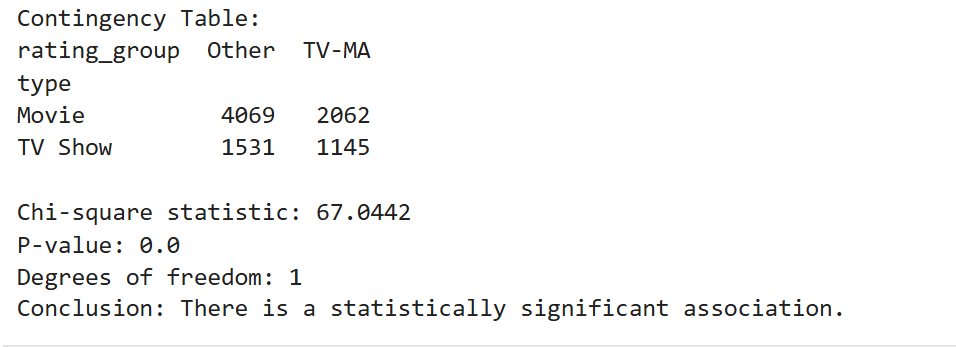
Statistical test results from the exploratory analysis.
7. Challenges and Learnings
Working on this project helped me understand that data analysis involves more than writing code or creating attractive charts. The quality of the findings depends on the quality of the data, the suitability of the analysis, and the clarity of the explanation.
My key learnings included:
- Identifying and handling missing values carefully.
- Using Pandas to explore and transform a real-world dataset.
- Creating visualizations with Matplotlib and Seaborn.
- Interpreting patterns without making unsupported assumptions.
- Understanding the purpose of hypothesis testing.
- Organizing analysis into a structured and reproducible workflow.
I also learned the importance of documenting each step so that other people can understand how the findings were produced.
8. Conclusion
The End-to-End EDA Report was a valuable learning experience that allowed me to apply Python and data analysis techniques to a real-world dataset. From inspecting and cleaning the data to exploring trends and creating visualizations, each stage contributed to a better understanding of the dataset.
The project strengthened my interest in Data Analytics and helped me improve my skills in data preparation, exploratory analysis, visualization, and reporting. It also showed me that meaningful analysis requires both technical work and clear communication.
I would like to continue building practical projects that turn raw data into understandable insights and support evidence-based decision-making.
Project Repository
GitHub: https://github.com/sadhanamang5/Netflix-Content-Analysis-EDA
Thank you for reading about my project and learning journey at Valentius Kryptix.


Leave a Reply
You must be logged in to post a comment.