

Introduction
SQL (Structured Query Language) is one of the most important tools used in Data Analytics. It helps analysts store, manage, retrieve, and analyse data from relational databases. Businesses use SQL to understand customer behaviour, monitor sales performance, identify trends, and make data-driven decisions.
As part of my internship at Valentius Kryptix, I worked on a project titled SQL for Data Analysis. The main objective was to develop practical SQL skills by solving real-world business questions using an e-commerce sales dataset.
In this project, I used SQLite and Python to create a relational database and perform different types of data analysis.
Project Overview
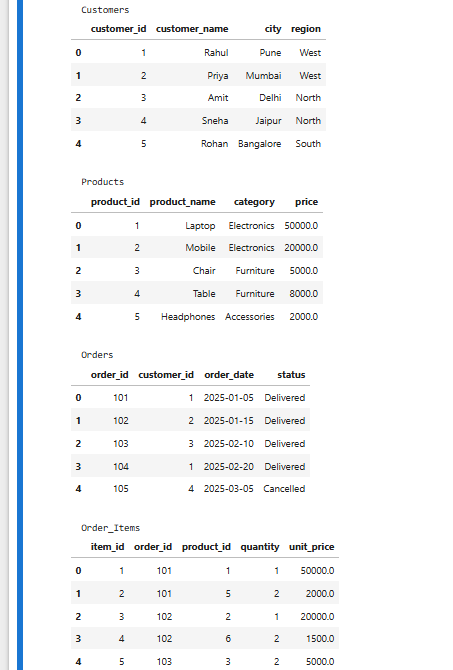
For this project, I created a sample e-commerce database containing four related tables:
- Customers: Contains customer details such as customer ID, name, city, and region.
- Products: Stores product information, including product name, category, and price.
- Orders: Contains order IDs, customer IDs, order dates, and order statuses.
- Order_Items: Stores product IDs, order IDs, quantities, and unit prices.
These tables were connected using primary keys and foreign keys. This relational structure helped me retrieve meaningful information from multiple tables using SQL JOIN operations.
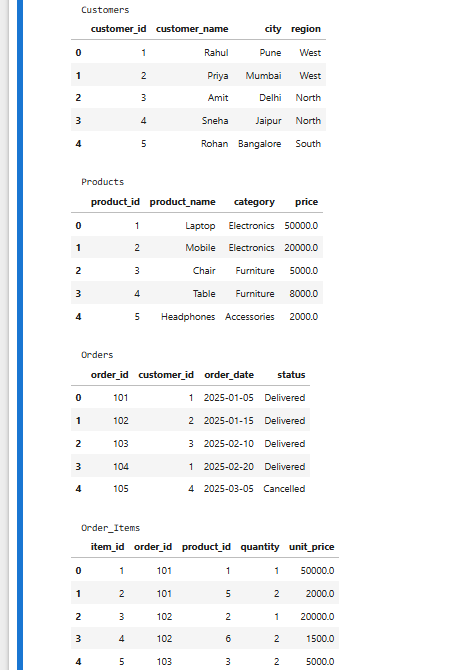
Caption: Relational database containing four connected tables.
Tools and Technologies Used
- SQLite: Used to create and manage the relational database.
- Python: Used to connect to the database and execute SQL queries.
- Jupyter Notebook: Used to write, execute, and document queries.
- Pandas: Used to display SQL query results in tabular format.
Business Questions and SQL Analysis
I developed and executed 10 business-focused SQL queries to analyse different aspects of the sample e-commerce data.
Some of the important questions included:
- Which are the top three products by revenue in each region?
- What is the month-over-month revenue growth?
- Which customers have not made a recent delivered purchase?
- Which product category generates the highest revenue?
- Who is the top-spending customer in each region?
- What is the cumulative monthly revenue?
- Which customers have placed multiple delivered orders?
- What is the average order value by region?
- How many orders belong to each order status?
- Which products have not appeared in any delivered order?
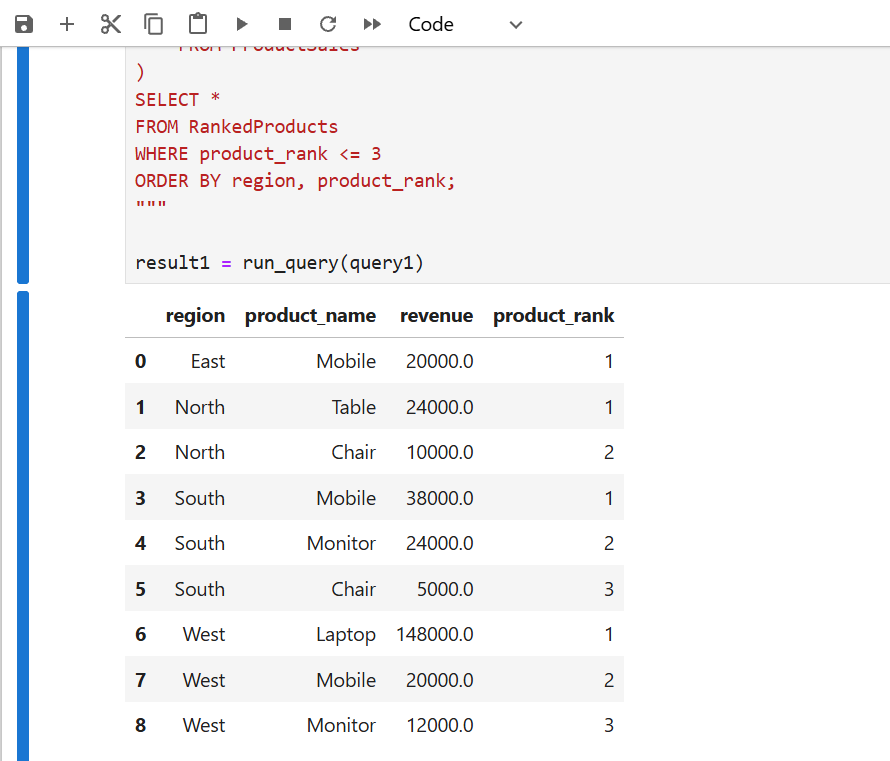
These questions helped demonstrate how SQL can be used to solve practical business problems rather than simply retrieving individual records.
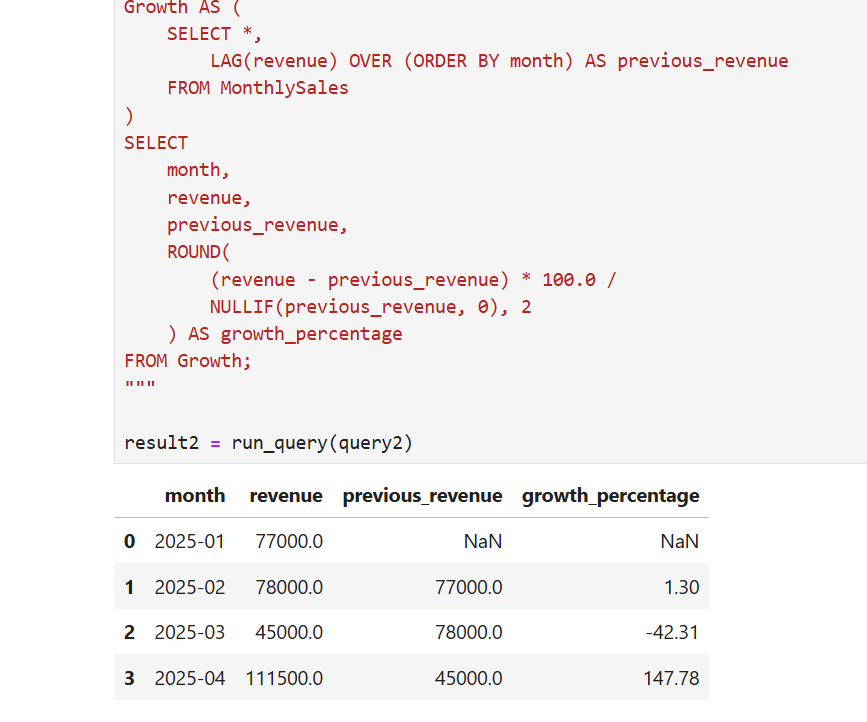
Month-over-Month Revenue – SQL Query Output
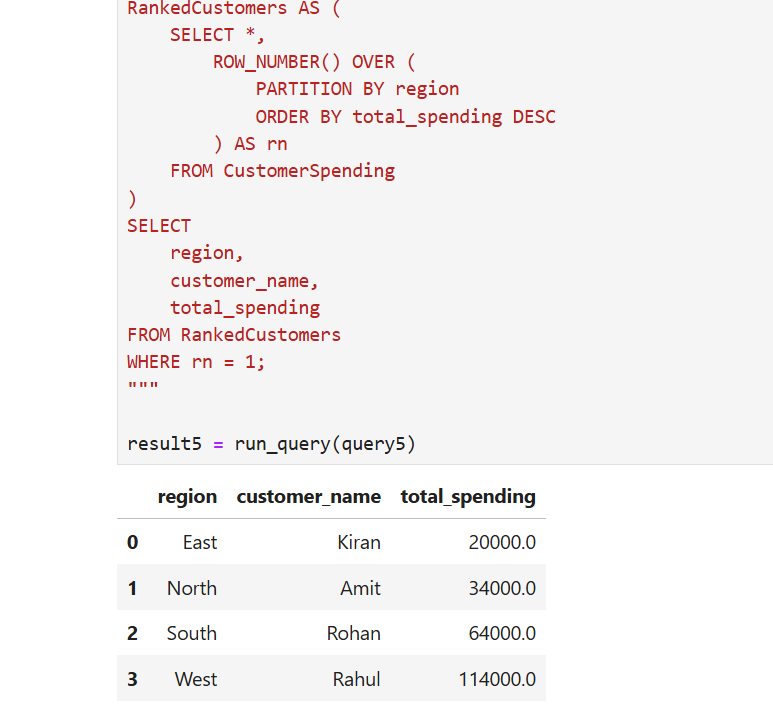
Top Spending Customer in Each Region
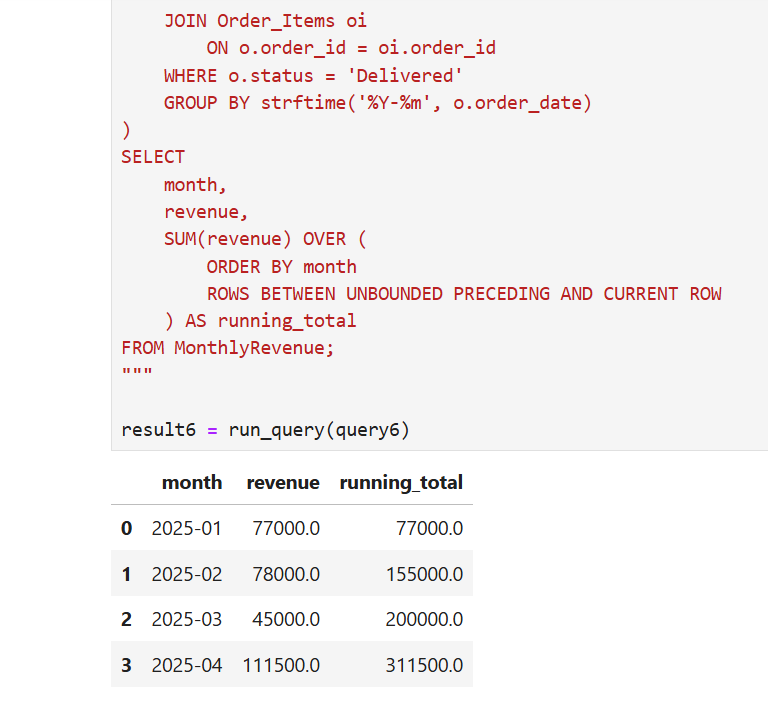
Cumulative Monthly Revenue Analysis
Key SQL Concepts Learned
1. Common Table Expressions (CTEs)
I used Common Table Expressions with the WITH clause to divide complex SQL queries into smaller, readable steps.
CTEs helped me organise calculations such as monthly revenue, customer spending, and product rankings.
2. Window Functions
I practised different window functions, including:
- RANK(): Used to rank products based on revenue within each region.
- ROW_NUMBER(): Used to identify the highest-spending customer in each region.
- LAG(): Used to compare monthly revenue with the previous month.
- SUM() OVER(): Used to calculate cumulative revenue over time.
These functions helped me perform analytical calculations that are difficult to handle using simple GROUP BY operations alone.
3. JOINs and Aggregations
I used INNER JOIN and LEFT JOIN to combine related tables. I also practised GROUP BY, HAVING, SUM(), COUNT(), AVG(), and ORDER BY to summarise business data and identify useful patterns.
Challenges and Learning Experience
One of the important parts of this project was understanding how multiple tables are connected and how to select the correct columns for analysis.
I also learned that query results must be checked carefully. A query should not only execute successfully but should also return meaningful and logically correct results.
Working with CTEs and window functions improved my understanding of advanced SQL concepts. Executing the queries in Jupyter Notebook also helped me connect database operations with Python-based data analysis.
Conclusion
This SQL for Data Analysis project helped me strengthen my understanding of relational databases and practical SQL techniques.
By answering 10 business questions, I gained hands-on experience in writing complex queries, combining multiple tables, calculating revenue, ranking customers and products, and analysing monthly trends.
I look forward to applying these skills to more data analytics projects and improving my ability to turn raw data into meaningful business insights.
Project Repository:
https://github.com/sadhanamang5/SQL-for-Data-Analysis
Tools Used: SQL | SQLite | Python | Pandas | Jupyter Notebook
Internship: Valentius Kryptix
#SQL #DataAnalytics #DataScience #Python #Internship #ValentiusKryptix

Leave a Reply
You must be logged in to post a comment.